Median House Price Map in the US 2000 vs 2025

Alex Cartwright
Senior Cartographer & GIS Specialist
Alex Cartwright is a renowned cartographer and geographic information systems specialist with over 15 years of experience in spatial analysis and data...
Geographic Analysis
What This Map Shows
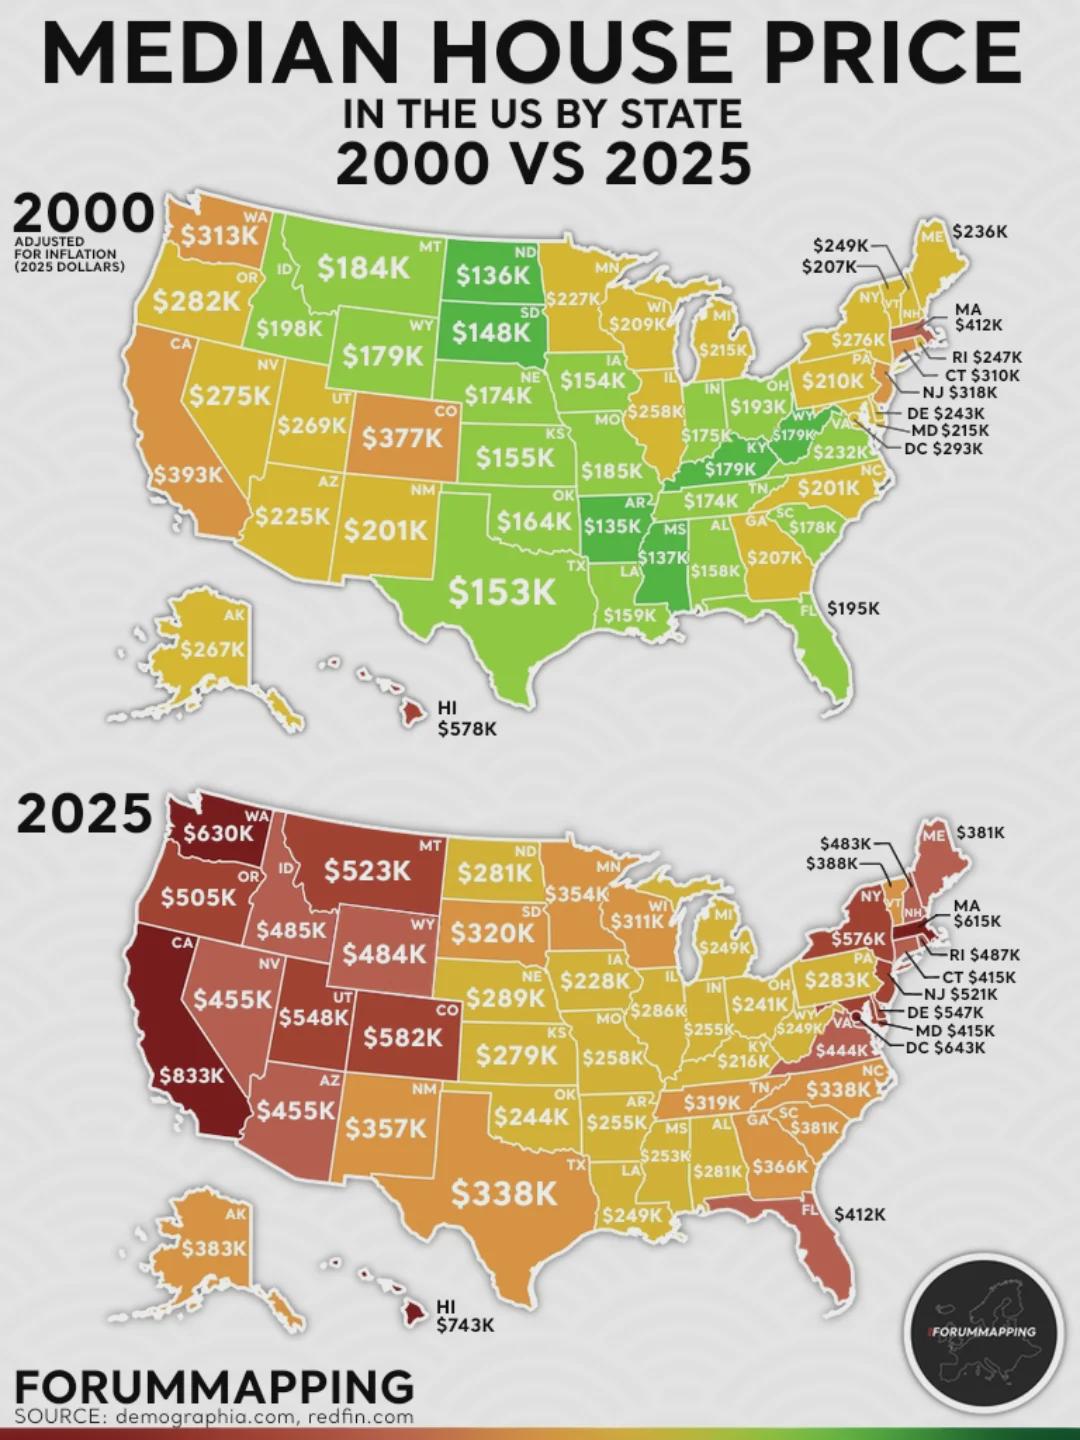
The visualization titled "Median House Price in the US by State in 2000 vs 2025" provides a comparative look at how the median house prices across different states in the United States have evolved over a 25-year span. By examining the data from the year 2000 and projecting it to 2025, this map highlights significant trends in housing costs that reflect broader economic changes, population shifts, and regional development patterns.
As we delve into the topic of housing prices, it's essential to recognize that they are not just numbers; they represent the affordability of living in different regions and can have profound implications for individuals and families seeking to buy homes.
Deep Dive into Housing Prices in the US
Housing prices in the United States are influenced by a myriad of factors, including economic conditions, interest rates, job growth, and demographic trends. In 2000, the median house price in the US was approximately $169,000, a number that has seen substantial appreciation over the years. By 2025, projections suggest that the median price could reach upwards of $350,000, reflecting a nationwide trend towards increasing housing costs.
Interestingly, some of the most dramatic increases in housing prices have occurred in states like California and New York, where urbanization and demand for housing in metropolitan areas have driven prices to astronomical levels. For instance, in 2000, the median house price in California was around $300,000, but projections for 2025 indicate that it could soar to over $800,000 in some areas. This steep increase can be attributed to a booming tech industry and a continual influx of people drawn to the state’s economic opportunities.
On the flip side, states in the Midwest, such as Ohio and Indiana, have experienced much more modest increases in housing prices. In 2000, Ohio's median house price was around $130,000, and projections suggest it may only reach approximately $180,000 by 2025. This slower growth can be partly attributed to a declining manufacturing sector and a decrease in population in some regions, leading to a surplus of housing and less upward pressure on prices.
Moreover, the affordability crisis is a growing concern. Ever wondered why some states are more affordable than others? Factors such as income levels, property tax rates, and housing supply play crucial roles. States like Texas and Florida, which have relatively low property taxes and no state income tax, are becoming increasingly attractive for homebuyers. Their median house prices are projected to rise but remain more manageable compared to states with higher costs of living.
Overall, the landscape of housing prices varies significantly across the United States. The map vividly illustrates these contrasts, showing not only the current state of the housing market but also its trajectory over the next few years.
Regional Analysis
Breaking down the map by region reveals fascinating insights into the housing market. In the Northeast, states like Massachusetts and New Jersey have historically high median prices, with projections indicating continued growth as urban centers expand. Massachusetts, for example, saw a median price of around $250,000 in 2000, with estimates for 2025 nearing $600,000.
In the South, states like Georgia and North Carolina are experiencing rapid growth, driven by migration and economic development. Georgia's median price, which was around $170,000 in 2000, is projected to approach $350,000 by 2025, correlating with its status as a booming tech and finance hub.
The West Coast remains the most expensive region, with California’s astronomical prices overshadowing other states. However, places like Washington and Oregon are also seeing significant increases. Interestingly, while the West Coast leads in price, many parts of the Midwest and South still offer affordable options, showcasing the diverse housing landscape across the country.
Significance and Impact
Understanding the trends in median house prices is crucial for prospective homebuyers, real estate investors, and policymakers alike. Rising prices can indicate economic growth, but they also pose challenges, particularly for low and middle-income families struggling to afford housing.
The implications of these trends are multifaceted. For one, they can lead to increased displacement in urban areas, as long-time residents may find themselves priced out of their neighborhoods. Furthermore, the affordability crisis can strain local economies, as workers may be unable to afford housing close to their jobs, leading to longer commutes and increased traffic congestion.
Looking ahead, the future of housing prices will likely be shaped by factors such as interest rates, the state of the economy, and ongoing demographic changes. Interestingly, as remote work becomes more commonplace, we may see shifts in housing demand, with people seeking homes in more affordable regions rather than traditional urban centers. Keeping an eye on these trends will be essential for anyone interested in understanding the evolving landscape of the US housing market.
Visualization Details
- Published
- October 29, 2025
- Views
- 10
Comments
Loading comments...