Water Hardness Across the United States Map

Alex Cartwright
Senior Cartographer & GIS Specialist
Alex Cartwright is a renowned cartographer and geographic information systems specialist with over 15 years of experience in spatial analysis and data...
Geographic Analysis
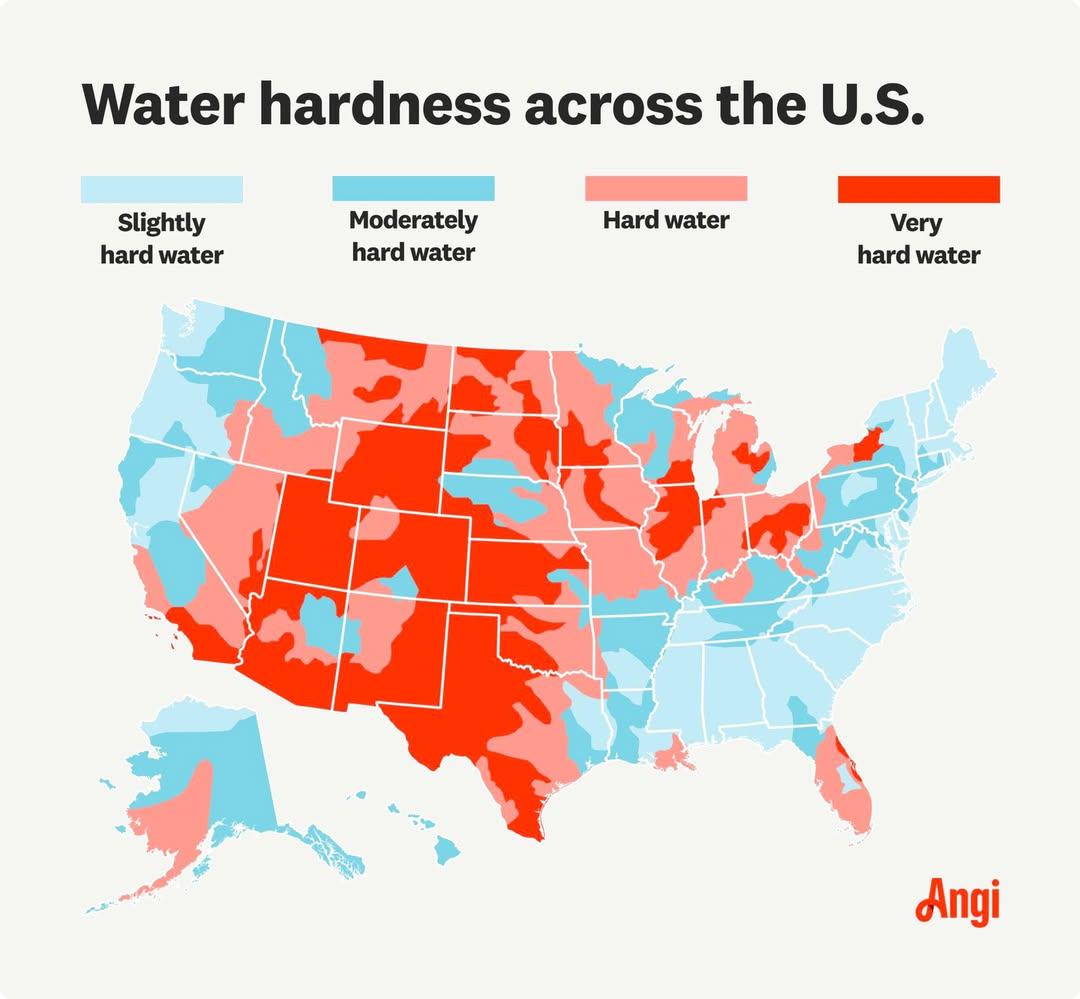
What This Map Shows
This map provides a clear visualization of water hardness across the United States, highlighting the varying levels of mineral content, particularly calcium and magnesium, found in drinking water sources. Water hardness is an important factor that influences not only the taste and quality of water but also has significant implications for household appliances, plumbing systems, and even health. The map categorizes regions into various hardness levels, allowing for a deeper understanding of how geology and water sources affect the quality of water that people consume.
Deep Dive into Water Hardness
Water hardness is primarily determined by the concentration of dissolved minerals in water, particularly calcium and magnesium. Soft water contains low concentrations of these minerals, while hard water has high levels. Interestingly, hard water is often more prevalent in areas where the geology consists of limestone and chalk, which dissolve into the water supply. This dissolution process can significantly affect not only the taste of the water but also its usability in household chores.
Hard water can lead to a variety of issues, including scale buildup in pipes and appliances, which can reduce efficiency and increase energy costs. For example, in areas with very hard water, residents may notice that their dishwashers and water heaters require more frequent maintenance due to mineral deposits. On the flip side, soft water, while easier on plumbing, may lack certain minerals that are beneficial for health.
Have you ever thought about how your local water hardness could affect your daily life? In fact, some studies suggest that higher levels of calcium and magnesium in drinking water may have health benefits, such as potential links to reduced cardiovascular disease. However, excessive hardness can lead to skin irritation and other health concerns.
The U.S. Geological Survey (USGS) provides valuable data on water hardness, categorizing it into ranges: soft (0-60 mg/L), moderately hard (61-120 mg/L), hard (121-180 mg/L), and very hard (greater than 180 mg/L). Regions like the Midwest, particularly states such as Wisconsin and Michigan, often report higher levels of hardness due to their geological makeup.
Regional Analysis
When examining the map of water hardness across the United States, notable regional differences emerge. For instance, the Northeastern states, including New York and Massachusetts, generally have softer water, attributed to their underlying geology comprised of granite and other igneous rocks. Conversely, the Midwest and parts of the South, such as Texas and Oklahoma, frequently experience hard water due to limestone deposits.
Interestingly, California presents a mixed picture. Northern California tends to have softer water, while Southern California, particularly in urban areas, shows higher levels of hardness. This variability can often be traced back to water sourcing practices, where water is transported from different regions, impacting its hardness levels.
The Southeastern U.S. showcases another contrast, with states like Florida exhibiting soft water due to its sandy aquifers, while neighboring Alabama and Mississippi report higher hardness levels. This regional breakdown illustrates how natural resources and geological characteristics influence water quality and availability.
Significance and Impact
Understanding water hardness is crucial for both consumers and policymakers. For homeowners, knowing the hardness level of their water can inform decisions about filtration systems and water softeners, helping to prevent mineral buildup in plumbing and appliances. Moreover, in areas where hard water is prevalent, local governments might consider implementing measures to address the impact on infrastructure and public health.
On a broader scale, water hardness can influence agricultural practices, particularly in irrigation, where hard water can affect soil health and crop yield. As water scarcity becomes an increasing concern in many parts of the country, ensuring that water quality meets the needs of both urban and agricultural users is essential.
Interestingly, as climate change continues to affect water sources and availability, projections suggest that regions currently facing hard water issues may experience further mineral concentration due to reduced water levels. This presents a challenge not only for water management but also for public health, as the balance of essential minerals in drinking water becomes even more critical.
In conclusion, the mapping of water hardness across the United States reveals much more than just mineral levels; it highlights the interplay between geology, public health, and everyday life. By paying closer attention to the hardness of our water, we can make informed choices that benefit both our households and our communities.
Whether you live in a region with soft or hard water, understanding these dynamics can empower you to take proactive steps to ensure the quality of your drinking water and its impact on your health and lifestyle.
Visualization Details
- Published
- October 24, 2025
- Views
- 20
Comments
Loading comments...