Vehicles Per Person by State Map

Marcus Rodriguez
Historical Geography Expert
Marcus Rodriguez specializes in historical cartography and geographic data analysis. With a background in both history and geography, he brings unique...
Geographic Analysis
What This Map Shows
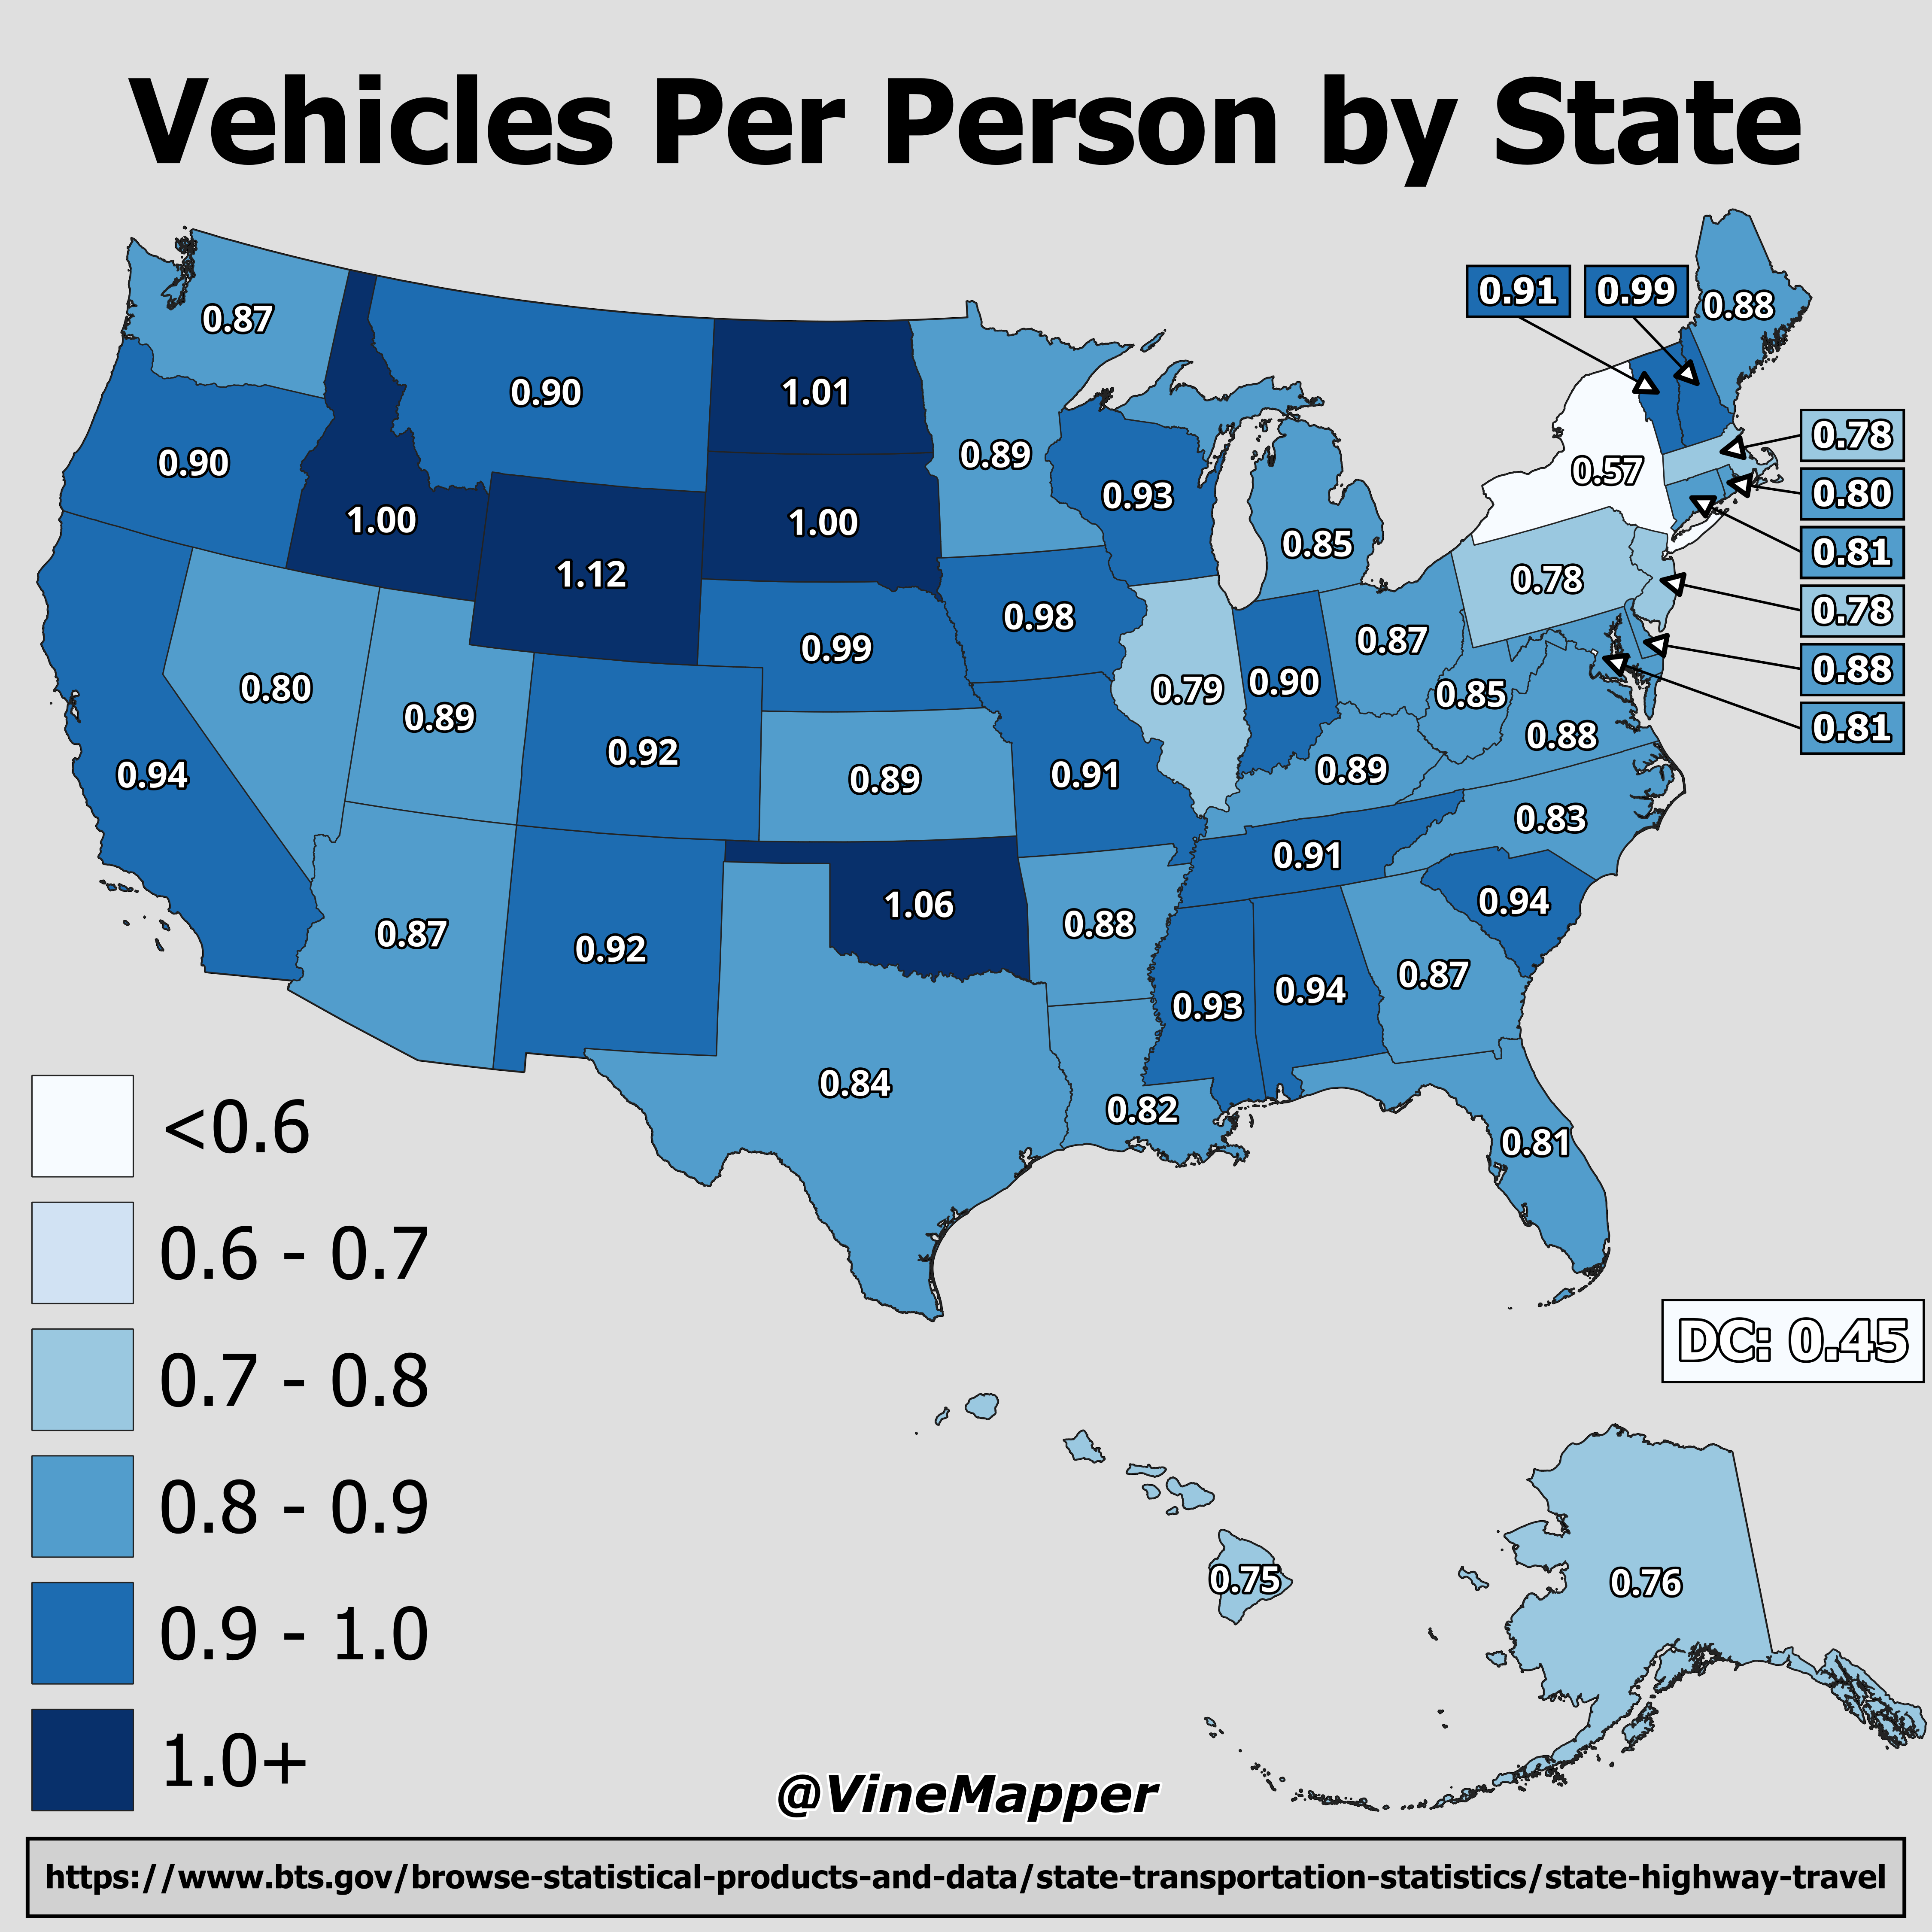
The "Vehicles Per Person by State" map provides a visual representation of the ratio of vehicles to the population across the United States. This visualization allows us to quickly see how vehicle ownership varies from one state to another, highlighting areas where automobile dependency is particularly high or low. As we delve into this topic, we will explore the implications of vehicle ownership on urban planning, social behavior, and environmental concerns.
Deep Dive into Vehicle Ownership Trends
Vehicle ownership is a crucial aspect of American life, reflecting not only economic factors but also cultural attitudes towards transportation. Interestingly, the number of vehicles per person can indicate various social trends. For instance, states with a higher number of vehicles per person often have sprawling suburban areas where public transportation options are limited. This leads to increased reliance on personal vehicles for commuting, shopping, and leisure activities.
According to the latest statistics, the national average is approximately 0.9 vehicles per person, but this figure varies significantly across states. In states like Wyoming and Montana, the vehicles per person ratio can exceed 1.5. This high number is often attributed to the vast rural landscapes where traveling long distances is unavoidable. Conversely, urban centers like New York City and San Francisco show vehicle ownership ratios below 0.5 due to the prevalence of public transportation and a cultural inclination towards walking or biking.
Moreover, the economic implications of vehicle ownership are significant. High vehicle ownership can correlate with higher gas consumption, increased traffic congestion, and greater environmental impact from emissions. As cities grapple with climate change and the need for sustainable transportation solutions, understanding these patterns becomes vital. For instance, states with high vehicle ownership are increasingly investing in alternatives, such as electric vehicles and enhanced public transit systems, to mitigate the environmental footprint.
The demographic factors also play a role in vehicle ownership. Younger generations are often delaying car purchases due to economic constraints, urban living preferences, or a growing interest in alternative modes of transportation. This trend could reshape the vehicle ownership landscape in the coming years, especially as cities evolve to accommodate these changing preferences.
Regional Analysis
When we break down vehicle ownership by region, distinct patterns emerge. For example, the Southern states, such as Texas and Florida, typically show higher vehicles per person ratios, often exceeding the national average. These states boast wide-open roads and less restrictive zoning laws, promoting a car-centric lifestyle. Texas, known for its expansive highways, has a ratio well over 1.2, underscoring its culture of automobile dependence.
In contrast, the Northeastern states, such as New York and Massachusetts, exhibit much lower ratios of vehicles per person. The dense urban environments and robust public transportation systems make car ownership less necessary. Interestingly, public transport in cities like Boston and New York not only eases congestion but also contributes to lower carbon emissions, showcasing a successful model of urban planning.
The West Coast, with its mix of urban and rural areas, presents a unique case. California, for instance, shows a high vehicle ownership ratio, driven by both urban sprawl and a culture that embraces the automobile. However, cities like San Francisco reflect lower ratios due to their walkability and extensive public transportation networks.
Significance and Impact
Understanding the vehicles per person ratio is more than just a statistic; it has real-world implications. It affects infrastructure planning, environmental policies, and economic strategies. For example, states with high vehicle ownership may face challenges such as increased traffic congestion, higher road maintenance costs, and greater air pollution levels. In response, many states are now prioritizing investments in public transportation and alternative energy vehicles.
Moreover, these trends can influence legislative decisions regarding transportation funding and environmental regulations. As we move towards a more sustainable future, the data from the vehicles per person map will be crucial in shaping policies that encourage public transport use, reduce emissions, and promote urban development that is both efficient and environmentally friendly.
As we look ahead, have you noticed the increasing presence of electric vehicles? This trend could significantly alter the vehicles per person ratios in the years to come, as more individuals opt for sustainable alternatives. The future of transportation in America may not just be about how many vehicles we own, but how we choose to use them.
Visualization Details
- Published
- October 15, 2025
- Views
- 26
Comments
Loading comments...