Correlation Map of Socioeconomic Factors

Marcus Rodriguez
Historical Geography Expert
Marcus Rodriguez specializes in historical cartography and geographic data analysis. With a background in both history and geography, he brings unique...
Geographic Analysis
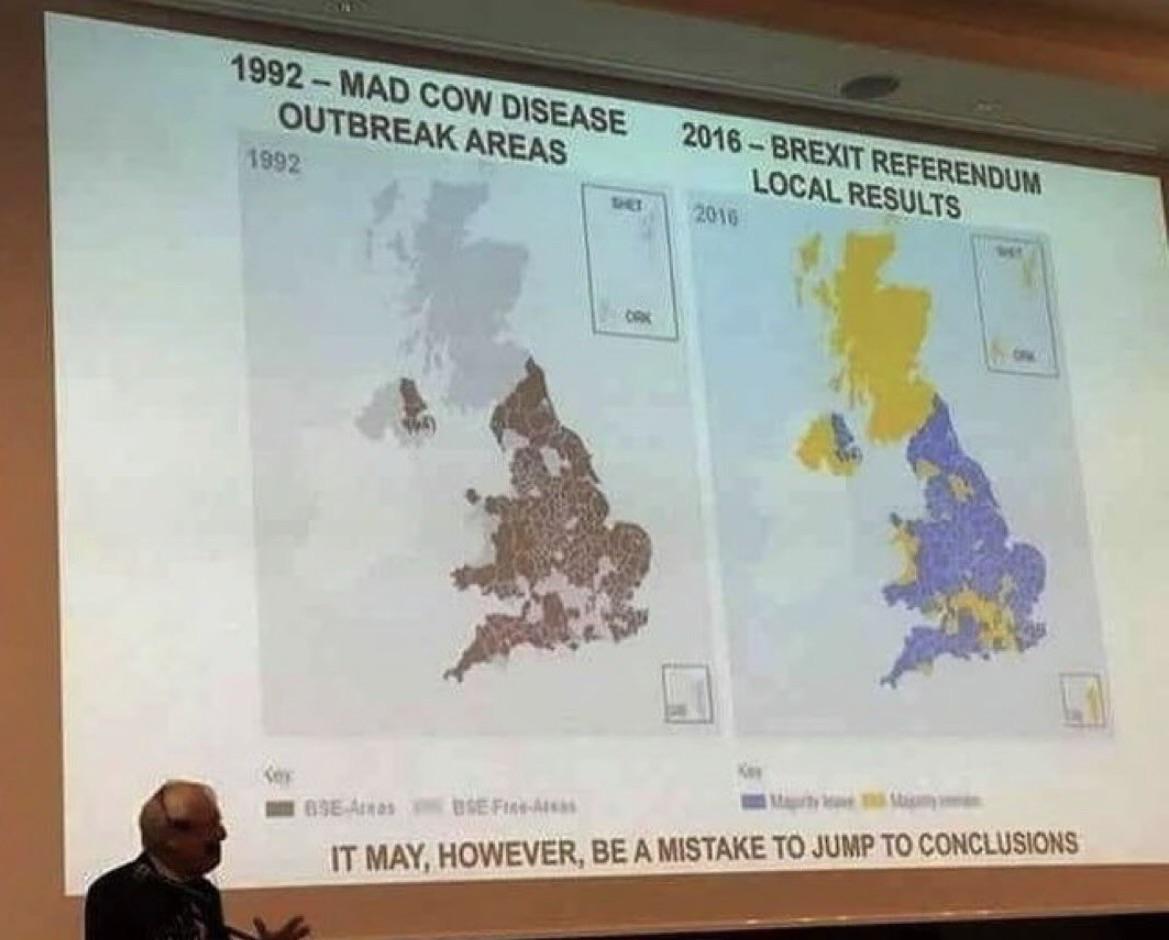
What This Map Shows
The "Correlation" map provides a visual representation of the relationships between various socioeconomic factors across different regions. By employing a series of color gradients and data overlays, the map highlights how indicators such as income levels, education rates, and health outcomes interrelate within specific geographical contexts. This visualization allows for a comprehensive overview of how these elements can influence community well-being and development.
Deep Dive into Socioeconomic Factors
Socioeconomic factors encompass a wide range of elements that define the living standards and quality of life of populations. These factors include income, education, employment rates, and health, among others. Understanding these dynamics is crucial because they shape everything from individual opportunities to broader societal trends.
Income levels serve as a primary indicator of socioeconomic standing, directly affecting access to education, healthcare, and overall quality of life. Interestingly, regions with higher average incomes typically boast better educational resources and healthcare facilities, creating a cycle of prosperity.
Education, often measured through literacy rates and school enrollment figures, plays a pivotal role in socioeconomic development. Regions with robust educational systems frequently experience lower unemployment rates and higher income levels. For instance, countries like Finland and Singapore consistently rank high in educational attainment and also showcase strong economic performance.
Health outcomes are yet another critical factor. Areas with high income and education levels tend to report better health statistics, including lower rates of chronic diseases and higher life expectancies. The correlation between education and health is particularly striking: better-educated individuals are more likely to engage in health-promoting behaviors and have access to healthcare services.
What's fascinating is that the interplay between these factors can create stark contrasts between regions. For example, within the United States, areas like Silicon Valley exhibit high income and educational attainment, while other regions, such as parts of Appalachia, struggle with poverty and lower educational outcomes. Such differences illustrate how socioeconomic factors can create divergent paths for communities.
Regional Analysis
The correlation map allows us to explore how socioeconomic factors manifest differently across various regions. For instance, in Northern Europe, countries like Norway and Sweden show a strong correlation between high income levels and educational attainment, leading to exceptional health outcomes. In contrast, Sub-Saharan Africa often grapples with lower income and educational levels, which can exacerbate health issues and limit economic opportunities.
In South Asia, countries like India present a mixed picture. Urban areas such as Mumbai and Bengaluru demonstrate high income and educational attainment, especially in technology sectors. However, rural regions continue to face significant challenges, including limited access to education and healthcare, illustrating the stark urban-rural divide.
Furthermore, Latin America reveals another layer of complexity. Countries like Chile and Uruguay have made strides in improving income and education levels, but inequality remains a pressing issue. In Brazil, for example, while some regions flourish economically, others are left behind, leading to vast disparities in quality of life and health outcomes.
Significance and Impact
Understanding the correlation between socioeconomic factors is more than just an academic exercise; it has real-world implications. Policymakers, urban planners, and non-governmental organizations rely on this data to craft targeted interventions aimed at improving community welfare. For instance, by addressing educational disparities in low-income areas, stakeholders can help break the cycle of poverty.
Current trends show a growing awareness of these correlations, particularly in the context of global events like the COVID-19 pandemic, which has highlighted the vulnerabilities of underserved populations. Future projections indicate that as nations continue to confront challenges like climate change and economic inequality, the need for comprehensive socioeconomic analysis will only increase.
Ultimately, the correlation map serves as a tool not only for understanding the present landscape but also for envisioning a more equitable future. By recognizing these interconnected factors, we can better strategize for sustainable development and social justice, ensuring that all communities have the opportunity to thrive.
Visualization Details
- Published
- October 3, 2025
- Views
- 42
Comments
Loading comments...