Most Common Southeast Asian Group by County Map

David Chen
Data Visualization Specialist
David Chen is an expert in transforming complex geographic datasets into compelling visual narratives. He combines his background in computer science ...
Geographic Analysis
What This Map Shows
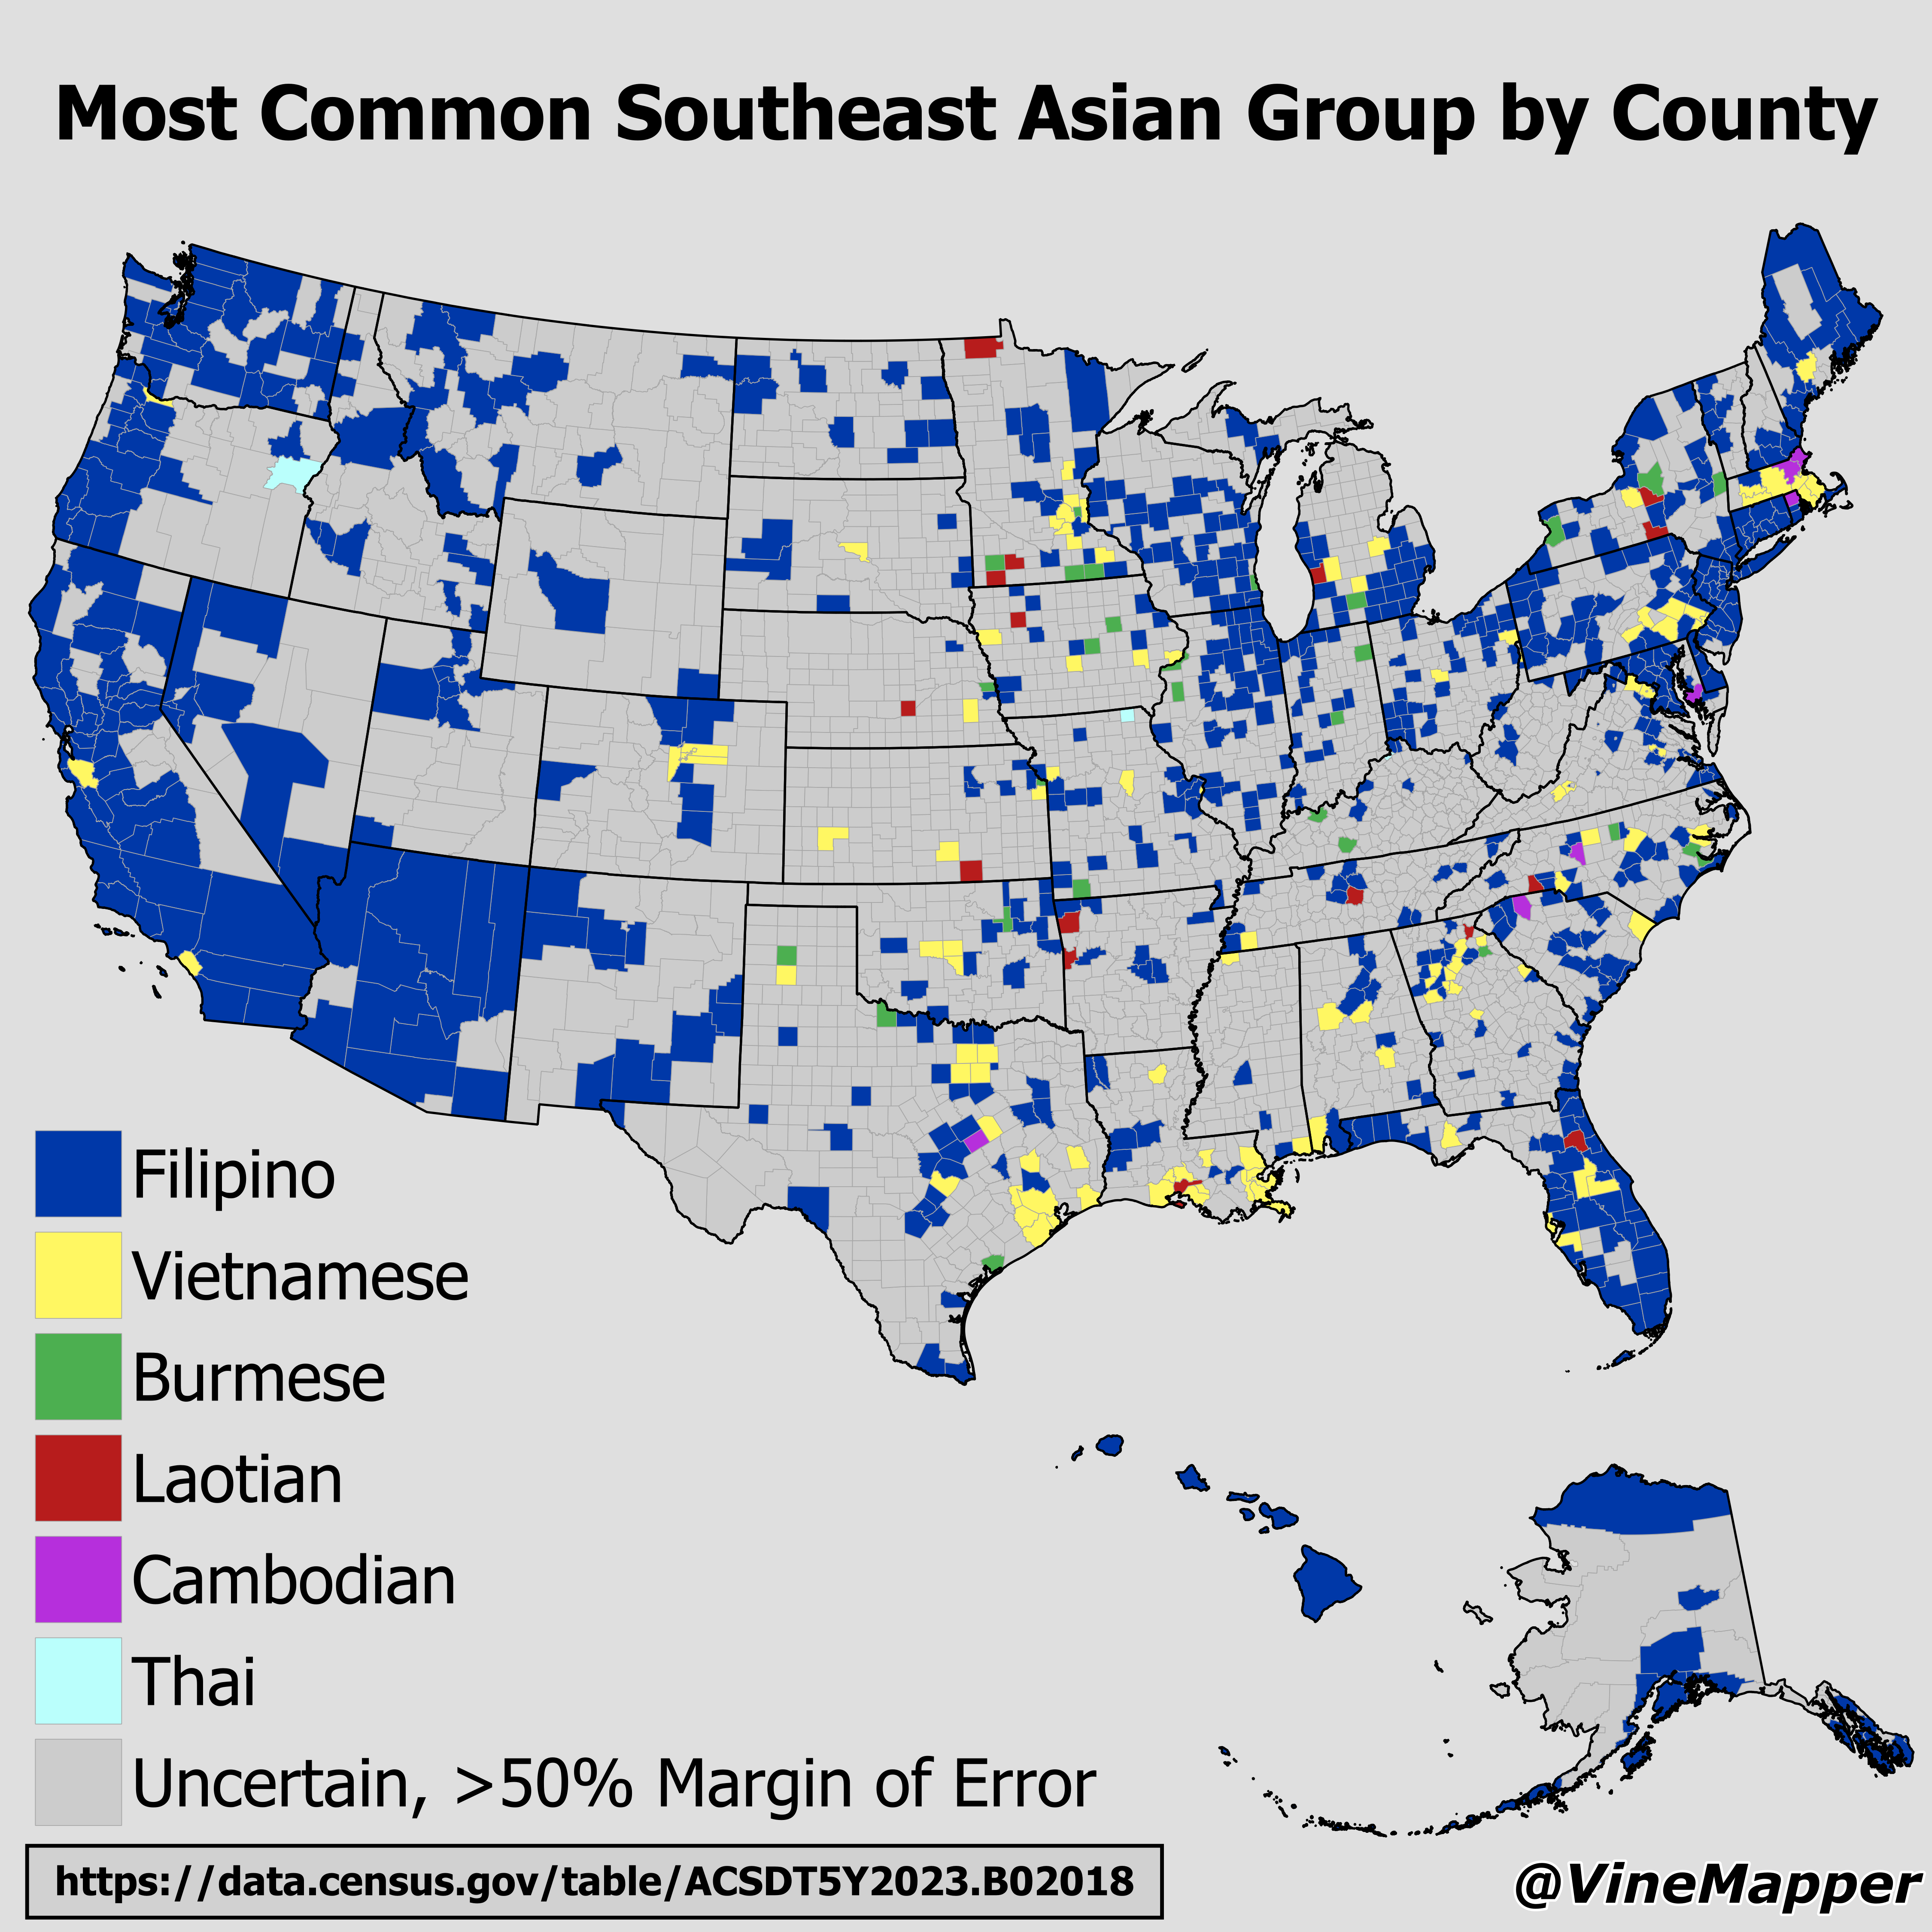
The "Most Common Southeast Asian Group by County Map" provides a detailed visualization of the predominant ethnic groups from Southeast Asia residing in various counties across the United States. This map highlights the diversity of Southeast Asian communities, illustrating not only where these groups are concentrated but also how their presence varies across different regions. Often overshadowed by larger Asian subgroups, the map reveals a rich tapestry of cultures and identities, emphasizing the importance of Southeast Asian populations in the broader landscape of American demographics.
Deep Dive into Southeast Asian Population
Southeast Asia is home to a myriad of ethnic groups, each with its unique cultural heritage, language, and traditions. This region includes countries like Vietnam, Thailand, the Philippines, Malaysia, Indonesia, and Myanmar, among others. According to the latest census data, the Southeast Asian population in the United States has been steadily growing, with significant communities originating from Vietnam, Laos, Cambodia, and the Philippines. What’s fascinating is that these groups often establish tight-knit communities, preserving their culture while also integrating into the American society.
The Vietnamese community, for example, is the largest Southeast Asian subgroup in the U.S., particularly concentrated in states like California and Texas. In cities such as Los Angeles and Houston, you’ll find vibrant Vietnamese neighborhoods filled with restaurants, markets, and cultural festivals. Interestingly, the history of these migrations often ties back to significant historical events, such as the Vietnam War, which prompted large waves of refugees to seek new beginnings in America.
Moreover, the Hmong population, primarily from Laos, has also established a notable presence, particularly in the Midwest, with Minnesota being home to one of the largest Hmong communities in the country. Their unique cultural practices and traditions, such as vibrant textile arts and traditional festivals, enrich the local culture and provide a glimpse into their heritage.
Southeast Asian populations are not only growing in numbers but also in their economic contributions. Many individuals from these communities have become entrepreneurs, launching businesses that cater to both their cultural needs and the broader market. Additionally, the younger generations are increasingly pursuing higher education, leading to enhanced social mobility within these communities.
Regional Analysis
Examining the map closely, we observe that California, particularly Los Angeles County, has a significant Vietnamese population, which is the most common Southeast Asian group in that area. This concentration can be attributed to historical immigration patterns and the establishment of community support networks. In contrast, the Midwest, especially Minnesota, showcases a higher concentration of Hmong residents, reflecting migration trends from Laos and the resettlement efforts during the 1970s and 1980s.
On the East Coast, areas such as New York City and Philadelphia have large Filipino communities, often drawn by job opportunities in healthcare and service industries. The diversity within these populations is noteworthy; for instance, you’ll find a blend of urban and rural backgrounds, influencing everything from culinary offerings to cultural celebrations.
Interestingly, even within counties, the dynamics can differ significantly. For example, while Los Angeles has a prominent Vietnamese presence, neighboring Orange County may have a more diverse mix, including Cambodians and Filipinos, showcasing the broader Southeast Asian tapestry. Understanding these dynamics can provide valuable insights into how cultural identities evolve and adapt in new environments.
Significance and Impact
The significance of understanding the distribution of Southeast Asian groups in the U.S. extends beyond mere demographics; it intersects with social, economic, and cultural realms. Recognizing these populations allows for better community planning, targeted social services, and policies that cater to the needs of these diverse groups. For instance, language access services in schools and community centers can significantly impact educational outcomes for children from these backgrounds.
Moreover, as Southeast Asian communities continue to grow, they play a pivotal role in the cultural landscape of America. Festivals like Tet (Vietnamese Lunar New Year) or the Hmong New Year celebrations not only preserve cultural traditions but also invite broader participation from the local population, fostering understanding and appreciation among diverse communities.
Looking ahead, the trends suggest that as immigration continues and younger generations become more integrated, these communities will further influence American culture, politics, and economy. The evolving identity of Southeast Asians in the U.S. is a testament to the resilience and adaptability of these groups, enriching the multicultural fabric of the nation.
In conclusion, the "Most Common Southeast Asian Group by County Map" is more than just a visual representation; it is a gateway to understanding the complexities and contributions of Southeast Asian communities in the United States today.
Visualization Details
- Published
- September 21, 2025
- Views
- 38
Comments
Loading comments...