Population Distribution and Area Map

David Chen
Data Visualization Specialist
David Chen is an expert in transforming complex geographic datasets into compelling visual narratives. He combines his background in computer science ...
Geographic Analysis
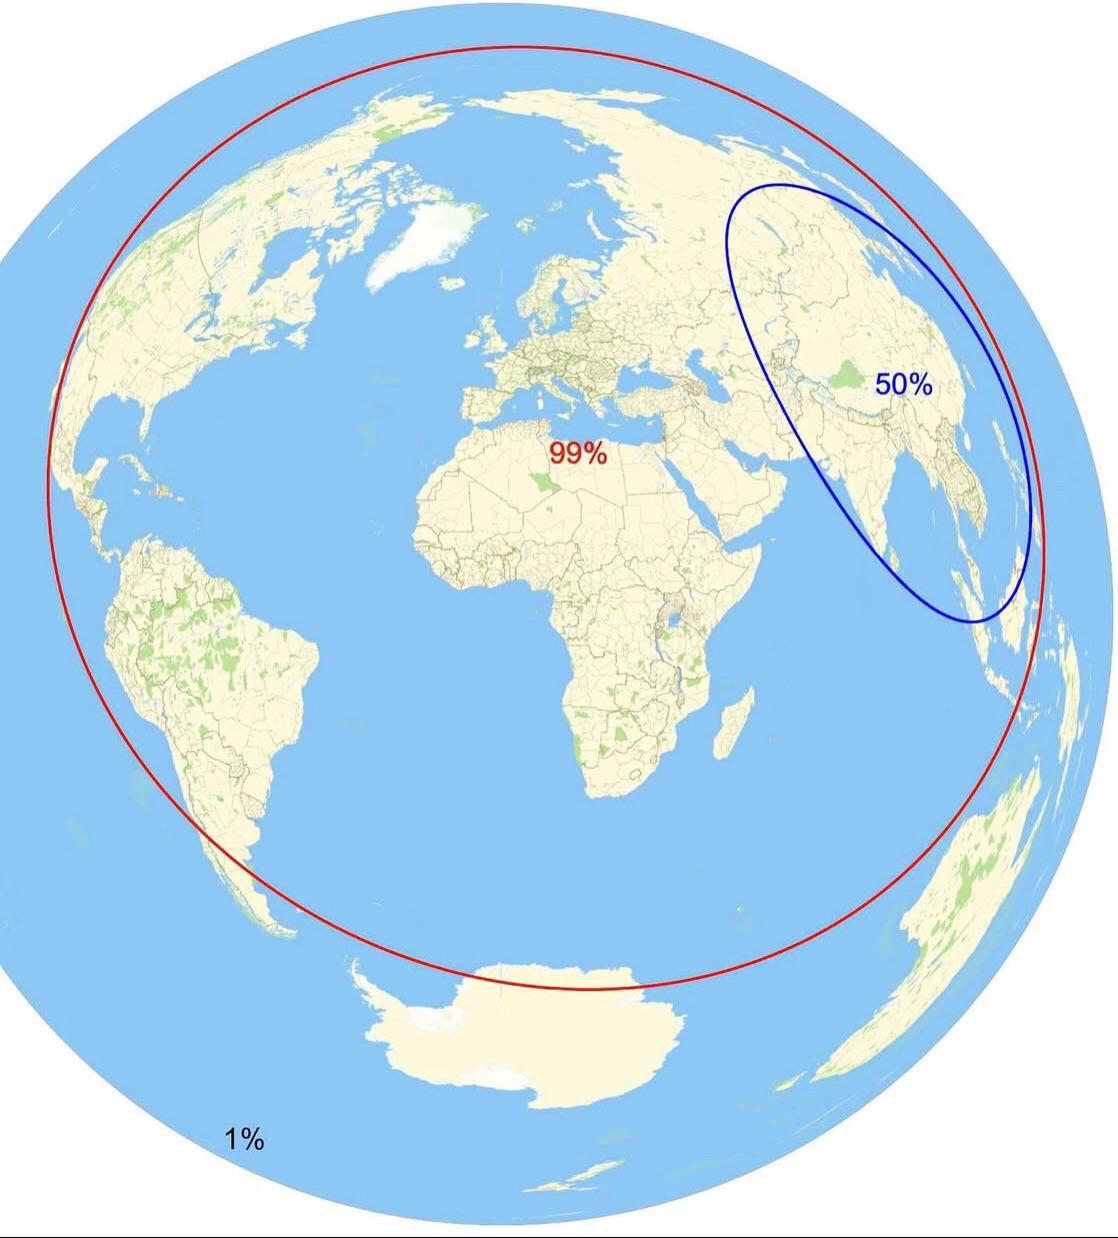
What This Map Shows
This map illustrates the percentage of the population and the area of distribution across various regions. It provides a visual representation of how populations are spread out in relation to the land they inhabit. By analyzing this data, we can gain insights into human settlement patterns, urbanization, and resource allocation.
Deep Dive into Population Distribution
Population distribution is a fundamental aspect of human geography that examines how people are spread across the Earth’s surface. It reflects a variety of factors including climate, economic opportunities, historical migrations, and cultural influences. Understanding these distribution patterns can help us comprehend urban development and rural-urban migration trends, which are crucial for effective city planning and resource management.
Interestingly, population density is not uniform across the globe. Some regions exhibit high concentrations of people, while others remain sparsely populated. For instance, urban areas like Tokyo and New York City are known for their dense populations, driven by economic opportunities and the availability of services. According to the latest statistics, Tokyo has a population density of over 6,000 people per square kilometer, making it one of the most densely populated cities worldwide.
On the other hand, vast areas of the Sahara Desert or the Arctic regions are almost devoid of human presence. These areas are characterized by harsh environmental conditions that make habitation challenging. In fact, about 90% of the global population lives in just 10% of the Earth’s land area, highlighting the stark contrast in population distribution.
Demographic trends also influence population distribution. For example, as countries develop economically, urbanization tends to increase, leading to the growth of megacities. The United Nations projects that by 2050, two-thirds of the world’s population will live in urban areas. This shift poses significant challenges and opportunities for urban planners and policymakers.
Regional Analysis
Examining the map regionally reveals significant disparities in population distribution. In North America, for example, the population is concentrated along the coasts and major cities such as Los Angeles, New York, and Toronto. These areas are often characterized by developed infrastructure, job opportunities, and access to education and healthcare.
In contrast, parts of the Midwest, such as North Dakota and South Dakota, showcase lower population densities, primarily due to their agricultural-based economies and limited urban centers. The map highlights how geography plays a pivotal role in shaping where people choose to live. Have you noticed how mountainous regions, like the Rockies or the Himalayas, also tend to have lower population densities due to the challenges posed by the terrain?
Moving to Asia, countries like India and China showcase some of the highest population densities in urban centers. Cities like Mumbai and Shanghai are melting pots of culture and commerce, drawing millions of people seeking better livelihoods. However, this leads to challenges such as overcrowding, pollution, and strain on resources. The map clearly delineates these hotspots of human activity.
Significance and Impact
Understanding population distribution and area significance is vital for various reasons. Firstly, it impacts economic development. Regions with higher populations often see more investment, infrastructure development, and access to services. Conversely, areas with lower populations may struggle to attract investment and maintain services.
Moreover, this topic bears implications for environmental sustainability. Urban areas contribute significantly to carbon emissions and resource consumption. As populations grow, the pressure on natural resources intensifies, leading to potential conflicts over water, land, and energy. What's fascinating is that many cities are now implementing policies aimed at sustainable urban development to mitigate these impacts.
In conclusion, analyzing population distribution through this map reveals much more than just where people live; it reflects historical, economic, and environmental narratives that shape our world. As we move forward, being mindful of these patterns will be crucial for creating sustainable and inclusive communities that can thrive in an ever-changing global landscape.
Visualization Details
- Published
- September 4, 2025
- Views
- 86
Comments
Loading comments...