High School Graduation Rates Map of the US

Marcus Rodriguez
Historical Geography Expert
Marcus Rodriguez specializes in historical cartography and geographic data analysis. With a background in both history and geography, he brings unique...
Geographic Analysis
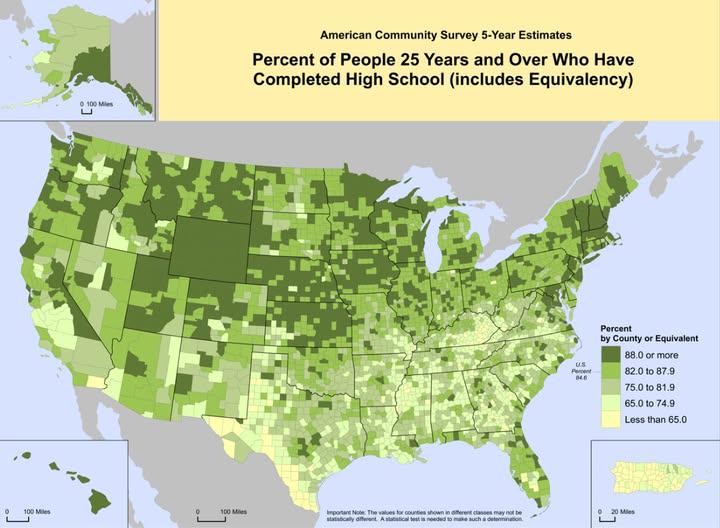
What This Map Shows
This map visualizes the percentage of individuals over the age of 25 in the United States who have completed high school. It provides a clear snapshot of educational attainment across various states and regions, highlighting disparities that exist in educational access and achievement. Understanding this landscape is crucial, as education is a fundamental pillar for personal and community development.
Deep Dive into High School Graduation Rates
High school graduation rates are more than just numbers; they reflect the educational opportunities available to different populations throughout the U.S. The attainment of a high school diploma has significant implications, influencing everything from employment prospects to income levels and social mobility.
Interestingly, the U.S. has seen improvements in high school graduation rates over the decades. According to the National Center for Education Statistics, the national graduation rate for high school students reached around 90% in recent years. However, this statistic masks a complex reality where variations are stark across different states and demographics. For instance, while states like Iowa and New Hampshire boast graduation rates above 95%, others, particularly in the South and West, may hover around 70-80%.
What’s fascinating is that graduation rates often correlate with socioeconomic factors. Areas with higher poverty rates tend to have lower graduation rates, which can be attributed to various challenges, including limited access to resources, underfunded schools, and a lack of community support. Additionally, the racial and ethnic disparities in graduation rates are alarming. For instance, while the graduation rate for white students is typically higher, Black and Hispanic students often graduate at lower rates, which speaks to systemic issues within the education system.
The impact of educational attainment extends beyond individual success. Communities with higher graduation rates often experience lower crime rates, higher civic participation, and overall better health outcomes. The correlation between education and economic stability is undeniable. According to the Bureau of Labor Statistics, individuals with at least a high school diploma earn significantly more than those without one, which underscores the importance of education in breaking cycles of poverty.
Regional Analysis
When analyzing the map, distinct patterns emerge among various regions. In the Northeast, states like Massachusetts and New York demonstrate high completion rates, often exceeding 90%. These states have robust educational systems, significant investment in public education, and a strong culture of valuing education.
Conversely, states like Mississippi and Louisiana show lower graduation rates, often around 80% or less. These figures reflect a combination of factors, including economic challenges, funding disparities, and a higher proportion of students from low-income backgrounds. Interestingly, even within states, there can be significant variation; urban areas may struggle more than suburban regions due to a host of socioeconomic factors.
The Midwest tends to fall in the middle ground, with states like Nebraska and Minnesota achieving rates around 90%, while others may lag behind. The West presents a mixed picture as well; states such as Washington and California have been making strides in educational attainment, yet they also face challenges with large populations of English language learners, which can impact overall graduation rates.
Significance and Impact
Why does it matter that we closely monitor high school graduation rates? The implications are vast. Education is often referred to as the great equalizer, and understanding these statistics can help policymakers, educators, and communities address inequities. Furthermore, as the job market evolves and demands higher levels of education, ensuring that individuals can access and complete high school becomes even more critical.
Furthermore, with the ongoing impact of the COVID-19 pandemic, there are concerns that graduation rates may decline due to disruptions in education. Schools have had to adapt rapidly, and the long-term effects of these changes on educational attainment could be significant. Trends suggest that without targeted interventions, we may see widening gaps in graduation rates among different demographic groups.
In conclusion, the map of high school graduation rates across the U.S. reveals a complex tapestry of educational attainment influenced by numerous factors. Understanding these dynamics not only informs educational policy but also helps us appreciate the critical role education plays in shaping society. Addressing these disparities is essential for fostering a more equitable future, ensuring that every individual has the opportunity to succeed.
Visualization Details
- Published
- August 31, 2025
- Views
- 62
Comments
Loading comments...