Median Disposable Net Household Income Map in Europe

Marcus Rodriguez
Historical Geography Expert
Marcus Rodriguez specializes in historical cartography and geographic data analysis. With a background in both history and geography, he brings unique...
Geographic Analysis
What This Map Shows
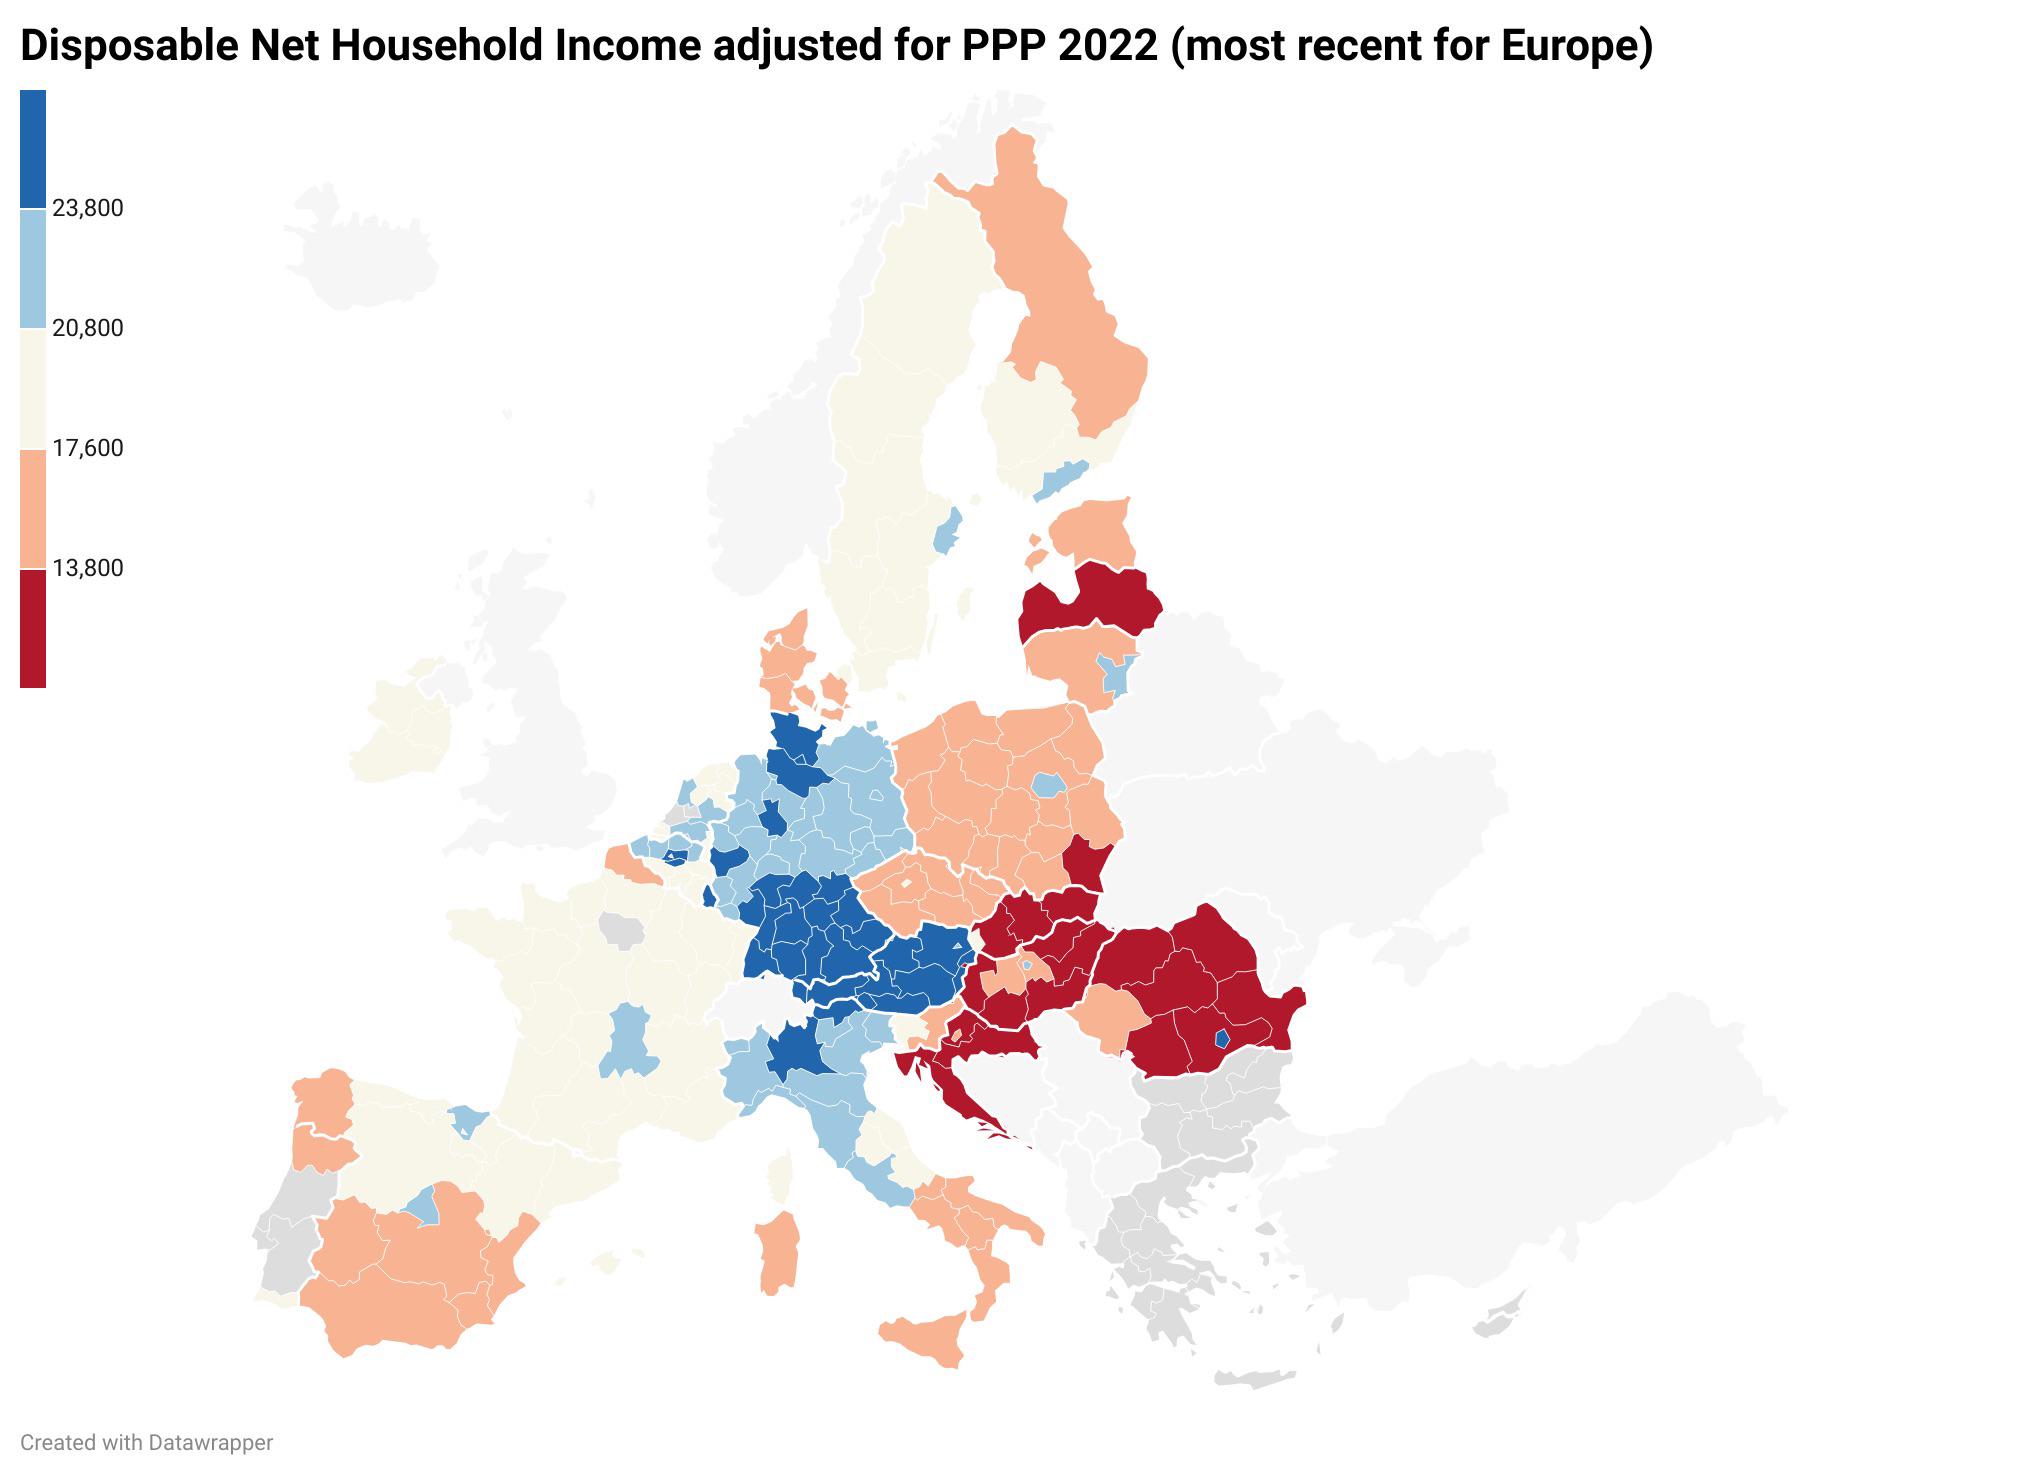
The "Median Disposable Net Household Income Adjusted for Purchasing Power Parity in Europe" map provides a clear visualization of how much income households across various European countries actually have at their disposal after taxes and social security contributions, adjusted for the cost of living in each country. This metric is vital for understanding economic well-being and the relative purchasing power of households within different regions. It highlights the disparities in income levels, allowing for an insightful comparison of economic health across the continent.
Deep Dive into Household Income in Europe
Household income is a critical indicator of economic stability and quality of life. In Europe, the concept of disposable income reflects the amount of money that households have available for spending or saving after they have paid taxes and received government transfers. However, what’s particularly interesting is how this income varies significantly across countries when adjusted for purchasing power parity (PPP).
Purchasing Power Parity is an economic theory used to determine the relative value of currencies. It suggests that exchange rates should adjust so that identical goods cost the same in different countries. Adjusting household income for PPP provides a more accurate picture of what that income can actually buy in terms of local goods and services, rather than just converting currency values.
For instance, while a high nominal income in a country might look impressive, if the cost of living is also high, the purchasing power can be significantly less than in a country with a lower nominal income but much lower living costs. This makes PPP a crucial consideration when evaluating household income.
In Europe, countries like Luxembourg and Switzerland often top the charts in terms of median disposable income. Luxembourg, with its robust financial sector and high wages, offers its residents a significant amount of disposable income. Conversely, countries like Bulgaria and Romania tend to have lower median disposable incomes, reflecting different economic structures and living costs.
Interestingly, the Nordic countries—such as Norway, Sweden, and Denmark—also rank highly on this map. They have strong welfare systems which provide substantial social security benefits, contributing to higher disposable incomes despite their high tax rates. This suggests a strong correlation between social safety nets and household income levels.
Furthermore, the map reveals the impact of economic policies and labor markets. Countries with strong labor rights and active employment policies often see higher disposable incomes because they can support better wages and job security. On the other hand, nations with less favorable labor conditions may struggle with lower income levels, affecting overall economic health and consumer spending.
Regional Analysis
When examining the map closely, several regional trends become apparent. Western Europe generally shows higher median disposable incomes compared to Eastern Europe. For example, not only does Germany boast one of the highest median disposable incomes, but it also plays a pivotal role in the European Union's economy, influencing policies that can directly benefit its citizens.
In contrast, Eastern European countries such as Hungary and Poland, while experiencing economic growth, still lag behind their Western counterparts in terms of disposable income. However, what’s fascinating is that these countries are on an upward trajectory, with rising incomes fueled by increased foreign investment and improved economic conditions.
Southern Europe presents a mixed picture. Countries like Spain and Italy have relatively high disposable incomes, yet they also face significant challenges including high unemployment rates, especially among youth. This indicates that while incomes may appear robust on paper, underlying economic issues can affect overall household well-being.
Significance and Impact
Understanding median disposable net household income adjusted for purchasing power parity is essential for policymakers, economists, and citizens alike. It offers insights into the economic disparities that exist within Europe, which can affect everything from consumer behavior to political stability. High levels of income inequality can lead to social unrest and dissatisfaction with governmental policies, highlighting the importance of addressing these disparities.
Furthermore, as Europe faces challenges such as aging populations, economic shifts due to globalization, and the impact of climate change, tracking household income trends will be critical. The COVID-19 pandemic has also raised questions about economic resilience and the ability of households to cope with sudden financial disruptions.
Looking ahead, it will be vital to monitor how these income levels evolve in response to economic policies and global economic conditions. Will countries continue to narrow the income gap, or will disparities persist? The answers to these questions will shape the future of economic policy and social stability in Europe.
By understanding this map and its implications, we can gain a clearer picture of the economic landscape of Europe, enabling better-informed decisions at both individual and governmental levels.
Visualization Details
- Published
- August 30, 2025
- Views
- 88
Comments
Loading comments...