Most Common Language Spoken at Home Map

David Chen
Data Visualization Specialist
David Chen is an expert in transforming complex geographic datasets into compelling visual narratives. He combines his background in computer science ...
Geographic Analysis
What This Map Shows
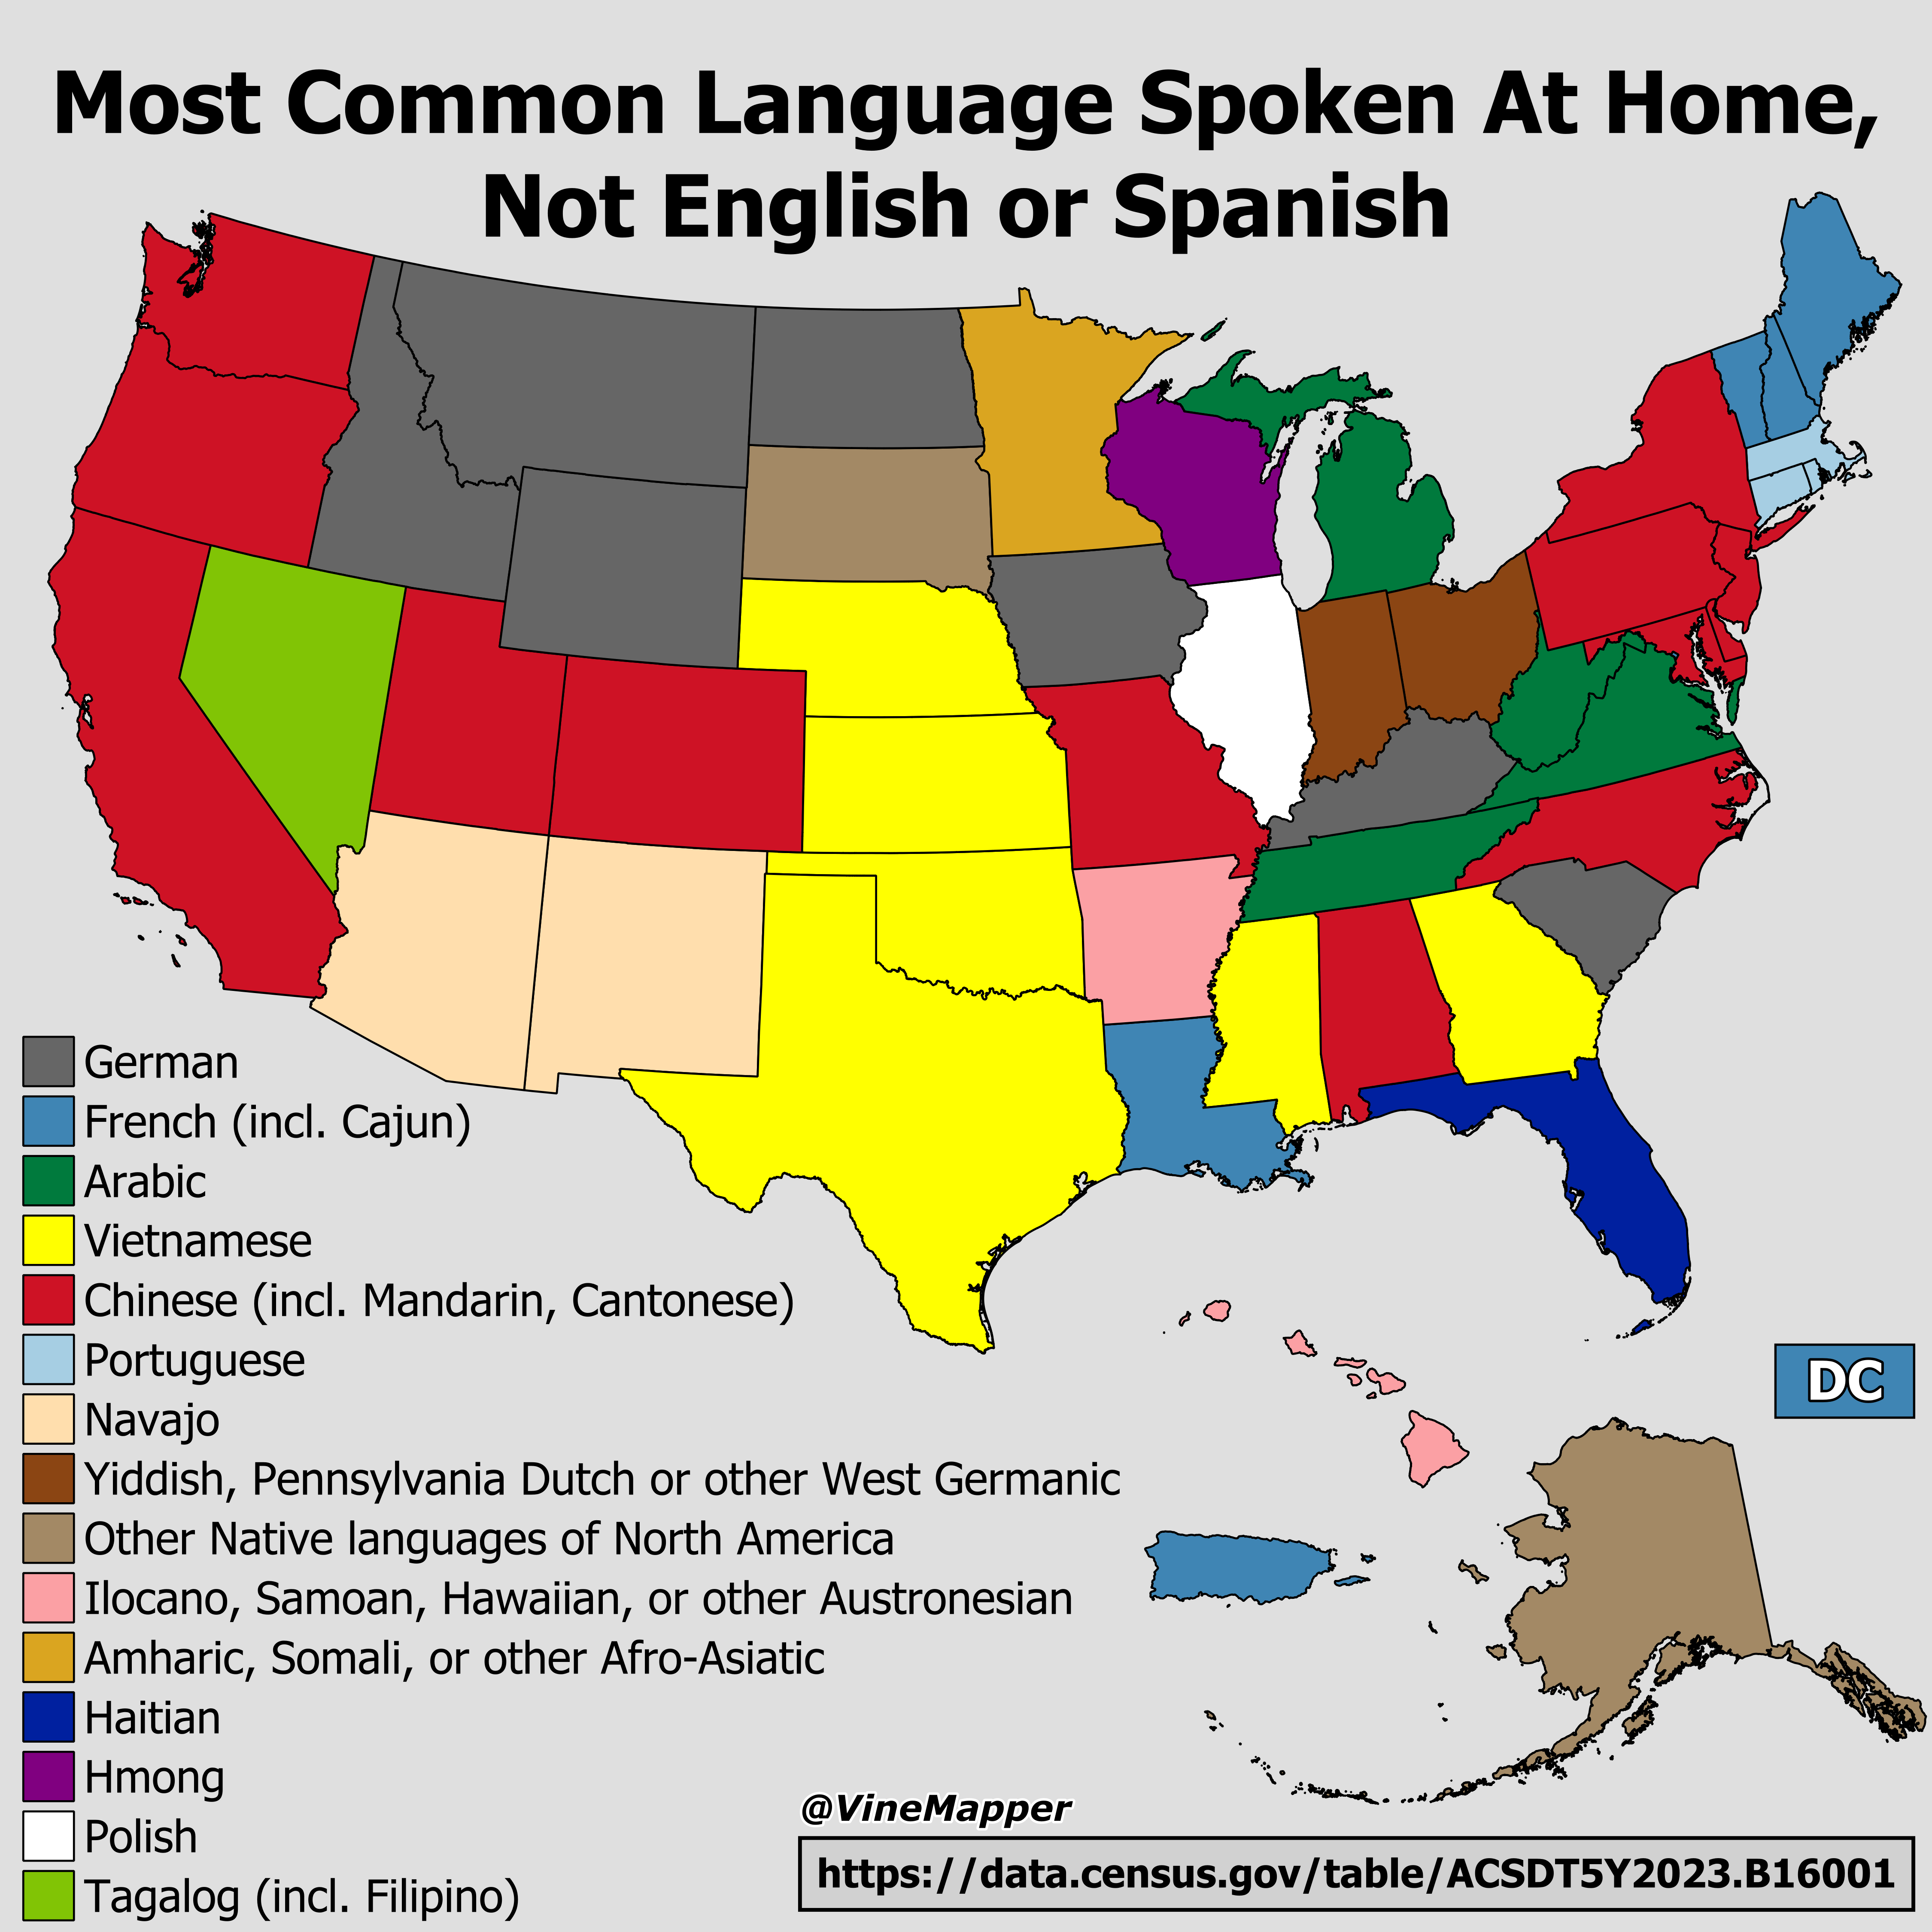
This map illustrates the most common languages spoken at home in various regions across the United States, excluding English and Spanish. It highlights the linguistic diversity that exists within American households, showcasing languages that often go unnoticed in everyday conversation. By examining this data, we can gain insight into the cultural tapestry of the nation and the immigrant communities that contribute to it.
Deep Dive into Language Diversity
Language is not just a means of communication; it’s a window into culture, identity, and community. In the U.S., over 350 languages are spoken, reflecting the country's rich immigration history. While English is the predominant language and Spanish is the second most common, it’s intriguing to explore the other languages that are prevalent in homes across the country.
Interestingly, languages like Chinese, Tagalog, Vietnamese, Arabic, and French have gained significant traction in recent decades. For instance, according to the U.S. Census Bureau, Mandarin Chinese has become the most widely spoken language in homes after Spanish, with millions of speakers, primarily due to the increasing Chinese immigrant population.
Tagalog, primarily spoken in the Philippines, is another language that has seen a rise in households. The Filipino community is one of the fastest-growing immigrant groups in the U.S., contributing to the language's prevalence. Similarly, Vietnamese has roots in the large Vietnamese American community that emerged after the Vietnam War, indicating strong cultural ties that persist through language.
Arabic's increasing presence is noteworthy as well, driven by recent immigration waves and the establishment of diverse Arab American communities. This growth reflects global migration trends and emphasizes the importance of understanding these languages within the context of American society.
What’s fascinating is that the languages spoken at home can often provide insight into economic and social networks. For example, communities that maintain their native languages often have robust support systems, cultural events, and educational resources that promote their heritage. This not only enriches the immediate community but also contributes to the broader American cultural landscape.
Regional Analysis
Examining the map reveals significant regional variations in language prevalence. In the West Coast states, such as California and Washington, a higher concentration of Chinese and Tagalog speakers can be observed. This aligns with the historical patterns of immigration that have favored these states as entry points for Asian immigrants. For instance, California hosts more than 1.5 million Mandarin speakers, reflecting the state's diverse population.
Conversely, in the Midwest, languages like Hmong and Somali are more commonly spoken at home. The Hmong community, which migrated to the U.S. post-Vietnam War, is particularly prominent in states like Wisconsin and Minnesota. Similarly, the Somali population has established strong communities in Minnesota, contributing to the state's linguistic diversity.
In the Northeast, languages such as Portuguese and Italian show prominence, reflecting the historical waves of European immigration. Cities like Newark, NJ, and Boston, MA, serve as cultural hubs for these communities, where language is a vital part of daily life. Interestingly, the presence of French in parts of Louisiana can also be traced back to historical migration patterns, showcasing the state's unique cultural heritage.
Significance and Impact
Understanding the most common languages spoken at home has profound implications for various sectors, including education, healthcare, and social services. As the U.S. continues to evolve demographically, recognizing and supporting linguistic diversity becomes essential. Schools, for instance, may need to adapt curricula to accommodate bilingual education, ensuring that children can maintain their heritage languages while learning English.
Moreover, in healthcare settings, language barriers can pose significant challenges. As communities grow more diverse, ensuring access to translators and culturally competent care becomes increasingly crucial. This is not just a matter of convenience; it's about equity and ensuring that everyone receives the quality care they deserve.
Looking ahead, the trends indicate that linguistic diversity in the U.S. will continue to expand. With globalization and migration patterns shifting, new languages will emerge, and existing ones will evolve. Understanding these dynamics will be key to fostering inclusive communities and celebrating the rich tapestry of cultures that define the United States.
In conclusion, the map of the most common languages spoken at home, excluding English and Spanish, provides valuable insights into the cultural and social fabric of America. It’s a reminder that language is not just a tool for communication; it’s a powerful symbol of identity and community that deserves recognition and support.
Visualization Details
- Published
- August 27, 2025
- Views
- 82
Comments
Loading comments...