Labor Participation Rate by State Map

Marcus Rodriguez
Historical Geography Expert
Marcus Rodriguez specializes in historical cartography and geographic data analysis. With a background in both history and geography, he brings unique...
Geographic Analysis
What This Map Shows
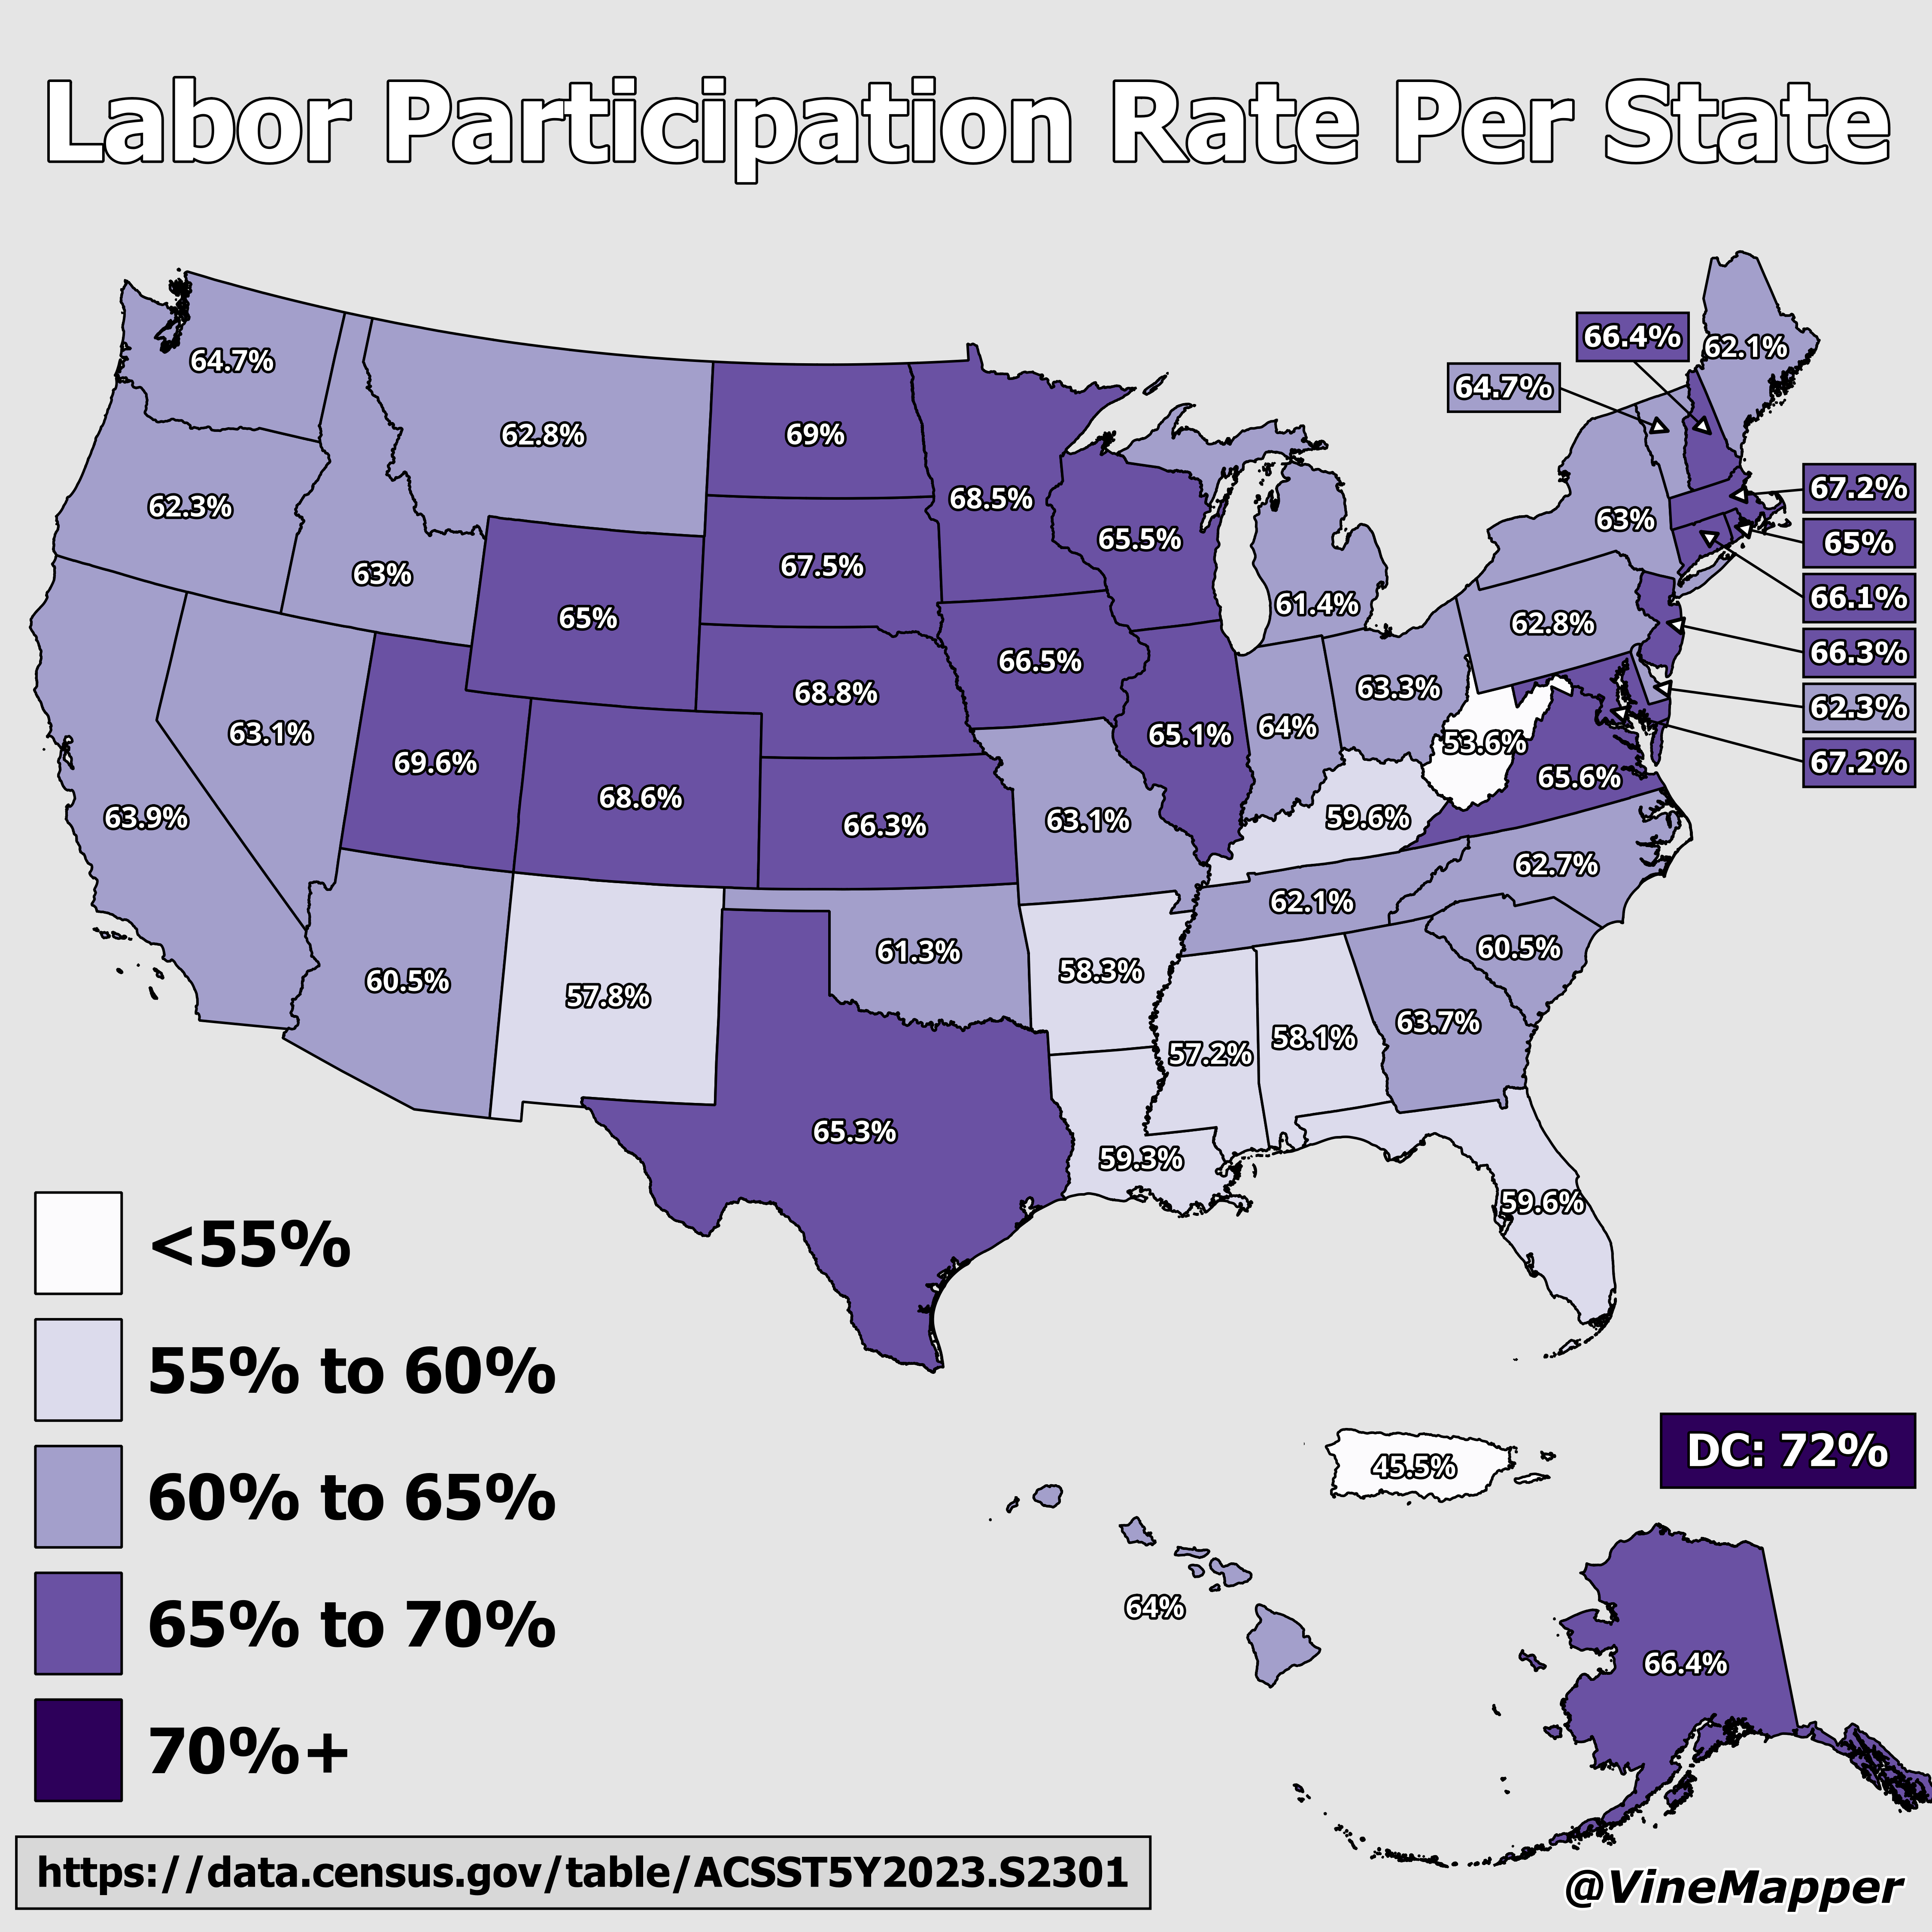
The "Labor Participation Rate by State Map" visualizes the percentage of the working-age population that is either employed or actively seeking employment in each U.S. state. This metric is crucial for understanding the economic landscape of the nation and provides insights into the workforce dynamics across different regions. With varying participation rates, the map highlights where economic opportunity is flourishing and where challenges may exist.
Deep Dive into Labor Participation Rates
Labor participation rates are a vital economic indicator, reflecting the health of a state's economy and the engagement of its population in the workforce. This rate is calculated by dividing the number of individuals in the labor force by the total working-age population, typically those aged 16 and older. Factors influencing these rates can be complex, encompassing economic conditions, education levels, demographic trends, and cultural attitudes towards work.
Interestingly, the national labor force participation rate has seen fluctuations over the years, particularly due to significant events such as the Great Recession and the COVID-19 pandemic. Currently, the labor participation rate hovers around 62%, but this figure masks considerable variances across states. For instance, states like Nebraska and Utah boast rates exceeding 70%, indicative of robust job markets and high employment opportunities. In contrast, states like West Virginia and Mississippi face participation rates below 55%, often due to economic challenges, including a decline in traditional industries, limited job availability, and demographic shifts such as an aging population.
Demographics play a crucial role in shaping labor participation rates. States with younger populations, such as Utah, tend to have higher participation rates as more individuals enter the workforce. Additionally, education levels correlate strongly with these rates; states investing in education and skill development often see higher labor participation. For example, Massachusetts, known for its educational institutions, enjoys a labor participation rate above the national average.
Moreover, cultural factors also contribute to the variations observed. In some regions, traditional views regarding gender roles may influence women's participation in the workforce, while in others, economic necessity drives higher participation from both genders. States that have embraced diversity and inclusion often witness more balanced participation across demographics.
Regional Analysis
Examining the map reveals distinct regional trends. The West and South generally exhibit higher labor participation rates compared to the Northeast and Midwest. For example, states like Colorado and Texas show vibrant participation, reflecting strong economic growth driven by sectors such as technology and energy. Here, the job market is booming, attracting a diverse workforce and resulting in higher participation rates.
Conversely, in the Midwest, states like Ohio and Michigan have struggled with economic transitions away from manufacturing, leading to lower participation rates. Interestingly, while Michigan's participation rate has improved with recent economic recovery, it still lags behind states with more diversified economies.
In the Northeast, states like New York and New Jersey present unique challenges. High living costs can deter individuals from entering the labor force, resulting in lower participation despite a significant number of job openings. In contrast, New England states such as New Hampshire and Vermont enjoy higher rates, potentially due to their smaller populations and higher median incomes.
Significance and Impact
Understanding labor participation rates is crucial for policymakers, businesses, and communities. High participation rates often correlate with economic vitality, lower unemployment rates, and greater consumer spending, which are essential for sustainable growth. Conversely, low participation can signal economic distress and lead to increased reliance on social services.
Current trends suggest that states are becoming more proactive in addressing labor participation challenges. For instance, many states are investing in job training programs, incentivizing businesses to hire, and promoting workforce development initiatives to engage underrepresented groups. Have you noticed that states with comprehensive workforce strategies tend to have more resilient economies?
Looking ahead, the implications of labor participation rates will continue to evolve, especially as demographics shift and technology impacts the job market. The rise of remote work, for example, may enhance participation rates in areas previously considered economically stagnant. Thus, understanding these dynamics is essential for fostering an inclusive and robust economy in the future.
Visualization Details
- Published
- August 23, 2025
- Views
- 80
Comments
Loading comments...