Night-time Light Map of Asia 2012 vs 2024

Alex Cartwright
Senior Cartographer & GIS Specialist
Alex Cartwright is a renowned cartographer and geographic information systems specialist with over 15 years of experience in spatial analysis and data...
Geographic Analysis
What This Map Shows
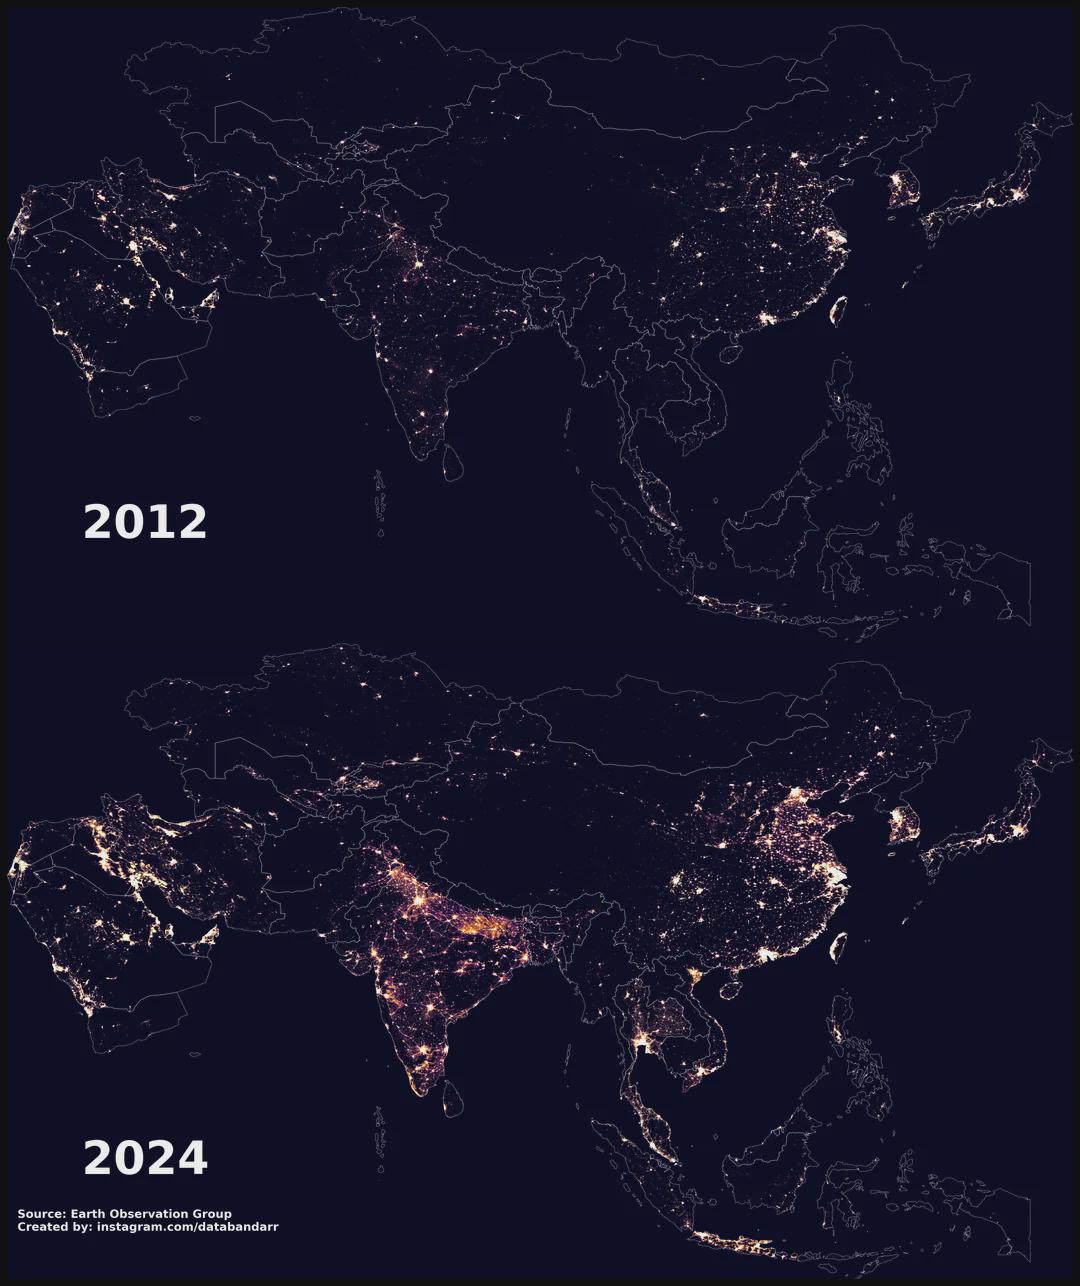
The "Night-time Light Map of Asia 2012 vs 2024" presents a compelling visual comparison of artificial light emissions across various regions in Asia over a span of twelve years. By analyzing the intensity and distribution of night-time lights, this map serves as a proxy for understanding urbanization, economic development, and even social changes within the continent. Night-time lights can indicate where populations are concentrated, where economic activity is booming, and how regions are evolving over time. This visualization starkly illustrates the transformation Asia has undergone, revealing insights into both growth and sustainability in the region.
Deep Dive into Night-time Lighting
Night-time lights are not just a pretty sight; they provide a wealth of information about human activity and development. When we look closely at how light is distributed at night, we can glean insights into population density, economic prosperity, and urbanization patterns. The increase in light intensity typically correlates with higher levels of industrial activity, greater economic output, and expanding infrastructure. Interestingly, areas that were once dimly lit in 2012 may now shine brightly in 2024, indicating new urban developments, increased investment, and migration trends.
In 2012, many parts of Asia, especially in regions like South Asia and Southeast Asia, showed relatively low levels of night-time illumination. However, by 2024, we can observe a significant increase in brightness across various urban centers, particularly in countries like India, Vietnam, and Bangladesh. For instance, cities like Dhaka and Ho Chi Minh City appear to have transformed into vibrant urban hubs, while areas that were previously rural are now dotted with light, reflecting rapid urbanization.
Moreover, the map indicates discrepancies between developed and developing regions. While Japan and South Korea maintain high levels of night-time lighting indicative of advanced economies, countries like Afghanistan and Myanmar still show lower light emissions, which can be attributed to ongoing challenges, including conflict and infrastructure deficits. This disparity offers a glimpse into the varying socio-economic landscapes across the continent.
Regional Analysis
When we break down the map by region, the differences in light emissions become even more pronounced. In East Asia, for example, major metropolitan areas like Beijing, Shanghai, and Seoul emit a significant amount of light, showcasing their status as economic powerhouses. The impressive urban sprawl and industrial growth in these cities have led to a marked increase in night-time illumination from 2012 to 2024.
Conversely, Southeast Asia has seen astonishing growth in cities such as Jakarta and Bangkok, where urban expansion and population growth are evident. The map highlights how cities in this region have transformed into bustling economic centers, with increased infrastructure and housing developments contributing to higher light emissions.
On the other hand, South Asia presents a mixed picture. While cities like Mumbai and Delhi have become more illuminated, reflecting their rapid urbanization, rural areas in countries like Nepal and Bhutan still remain relatively dark. This contrast underscores the ongoing urban-rural divide within the region, where urban centers continue to grow at the expense of rural communities.
Interestingly, Central Asia shows a different trend. Countries like Kazakhstan exhibit stable light levels, indicating a consistency in economic activity, but less dramatic growth compared to their Southeast Asian counterparts. This stability may highlight the region’s reliance on resource extraction and energy production, rather than expansive urban development.
Significance and Impact
The implications of night-time light patterns extend beyond mere aesthetics; they reflect socio-economic realities that can influence policy and planning. Understanding where and why light emissions are increasing helps governments and organizations target resources effectively. For instance, regions with rapid urbanization may require additional infrastructure, such as transportation, utilities, and social services, to support growing populations.
Moreover, the significance of light emissions can also be tied to environmental considerations. Increased urban lighting contributes to light pollution, which can disrupt local ecosystems and affect human health. As cities strive to balance growth with sustainability, the challenge will be to promote development while minimizing ecological impacts.
Looking ahead, projections suggest that night-time lighting in Asia will continue to evolve, especially as emerging economies grow and urban centers expand. The ongoing shift towards smart city initiatives and sustainable urban planning could lead to more efficient use of resources, ultimately affecting the brightness of cities across the continent. As we monitor these changes, it becomes vital to consider not just the economic implications, but also the environmental and social dimensions that will shape the future of urban life in Asia.
Visualization Details
- Published
- August 22, 2025
- Views
- 8
Comments
Loading comments...