Total Alcohol Consumption Per Capita Map

Marcus Rodriguez
Historical Geography Expert
Marcus Rodriguez specializes in historical cartography and geographic data analysis. With a background in both history and geography, he brings unique...
Geographic Analysis
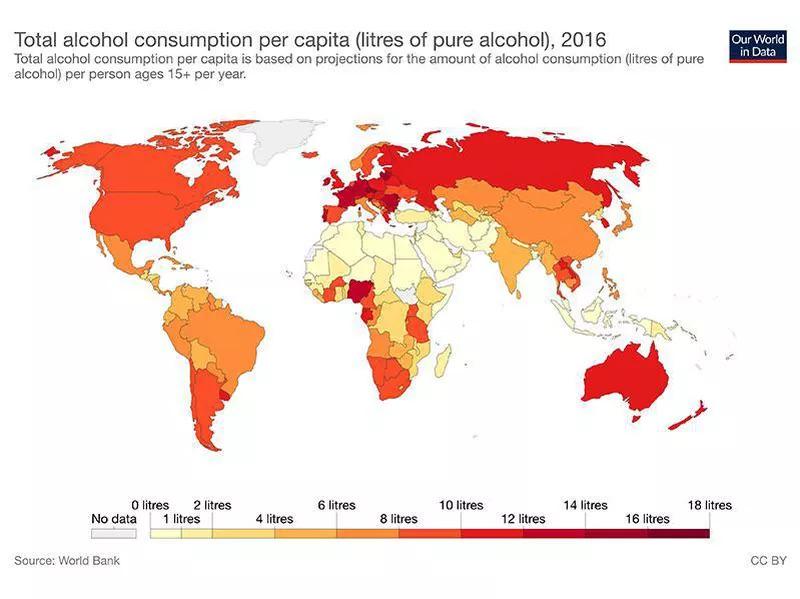
What This Map Shows
The "Total Alcohol Consumption Per Capita Map" visually represents the average alcohol consumption in liters per person across various countries. This data reflects not only the drinking habits of populations but also cultural norms, legal regulations, and socioeconomic factors that influence alcohol consumption patterns. By studying this map, we can gain insights into how different nations approach alcohol as a part of their social fabric.
Deep Dive into Alcohol Consumption
Alcohol consumption is a significant aspect of various cultures worldwide. Interestingly, it can serve as a reflection of social behaviors, health trends, and even economic conditions. Globally, the average alcohol consumption per capita has shown some remarkable trends. According to the World Health Organization, in 2021, the global average stood at about 6.4 liters of pure alcohol per person aged 15 and older. This figure, however, masks a vast diversity in consumption patterns.
In Europe, for instance, alcohol consumption tends to be higher on average than in other continents. Countries like Moldova and Belarus consistently rank at the top, with per capita consumption exceeding 14 liters. This high level of consumption is often attributed to cultural acceptance of drinking, social gatherings that revolve around alcohol, and even the historical significance of local beverages.
Conversely, regions such as the Middle East and parts of Asia report much lower consumption levels, largely due to religious and cultural prohibitions against alcohol. For example, in countries like Afghanistan and Saudi Arabia, per capita consumption can be as low as 0.1 liters, reflecting strict regulations and social norms surrounding alcohol use.
What’s fascinating is that alcohol consumption does not always correlate with overall health indicators. In fact, some countries with high alcohol intake also face significant public health challenges, including higher rates of alcohol-related diseases. Interestingly, the relationship between alcohol consumption and health is complex; while moderate consumption can have some health benefits, excessive use leads to serious health risks.
Additionally, the economic context plays a crucial role in shaping drinking habits. In wealthier nations, you might find a trend towards craft beers and premium spirits, while in lower-income countries, the focus may be on cheaper, locally produced alcoholic beverages. This difference can impact not only health but also economic productivity and social stability.
Regional Analysis
When analyzing the map by region, several patterns emerge. In Europe, the highest consumption rates are observed in Eastern European countries like Moldova, Belarus, and Lithuania. Here, tradition plays a significant role, with alcohol often being a staple at social gatherings, festivals, and even in everyday meals. Alcohol is deeply woven into the cultural identity, contributing to its higher consumption rates.
In contrast, Western European countries like Italy and Spain demonstrate a more moderate approach, focusing on wine consumption that aligns with culinary traditions rather than sheer volume. Interestingly, these countries often emphasize moderation and social drinking, which may contribute to lower consumption rates compared to their Eastern counterparts.
In North America, the United States shows a diverse drinking culture, influenced by both historical and modern factors. Consumption patterns can vary dramatically from state to state, with urban areas often exhibiting higher levels of alcohol consumption compared to rural ones. Furthermore, the craft beer revolution has led to increased consumption among certain demographics, particularly younger adults. Canada shows similar trends, with a focus on craft and local beverages, though overall consumption is slightly lower compared to the U.S.
In Asia, regions like Japan exhibit a unique perspective on alcohol. Sake is not only a traditional beverage but also a cultural symbol. However, overall consumption rates are lower than the global average, partly due to social pressures and changing attitudes towards drinking among younger generations. In contrast, countries like China are witnessing rising consumption rates, particularly among the middle class, as alcohol becomes more integrated into social and business interactions.
Significance and Impact
Understanding alcohol consumption patterns is crucial for several reasons. Public health officials and policymakers can use this data to address alcohol-related issues, tailor interventions, and create policies that promote responsible drinking. Moreover, the economic implications are significant; high consumption rates can lead to increased healthcare costs and loss of productivity due to alcohol-related illnesses.
Current trends indicate a growing awareness of the health risks associated with excessive drinking, leading to campaigns promoting moderation. Interestingly, there’s also a rise in the popularity of non-alcoholic beverages, reflecting a shift in consumer preferences. As people become more health-conscious, this could influence future drinking trends and alter consumption patterns.
In conclusion, the "Total Alcohol Consumption Per Capita Map" not only highlights where alcohol is consumed most but also opens a dialogue about the cultural, health, and economic factors at play. It's a reminder that while alcohol can be a source of enjoyment and socialization, it also carries significant responsibilities and implications for individuals and societies at large.
Visualization Details
- Published
- August 12, 2025
- Views
- 112
Comments
Loading comments...