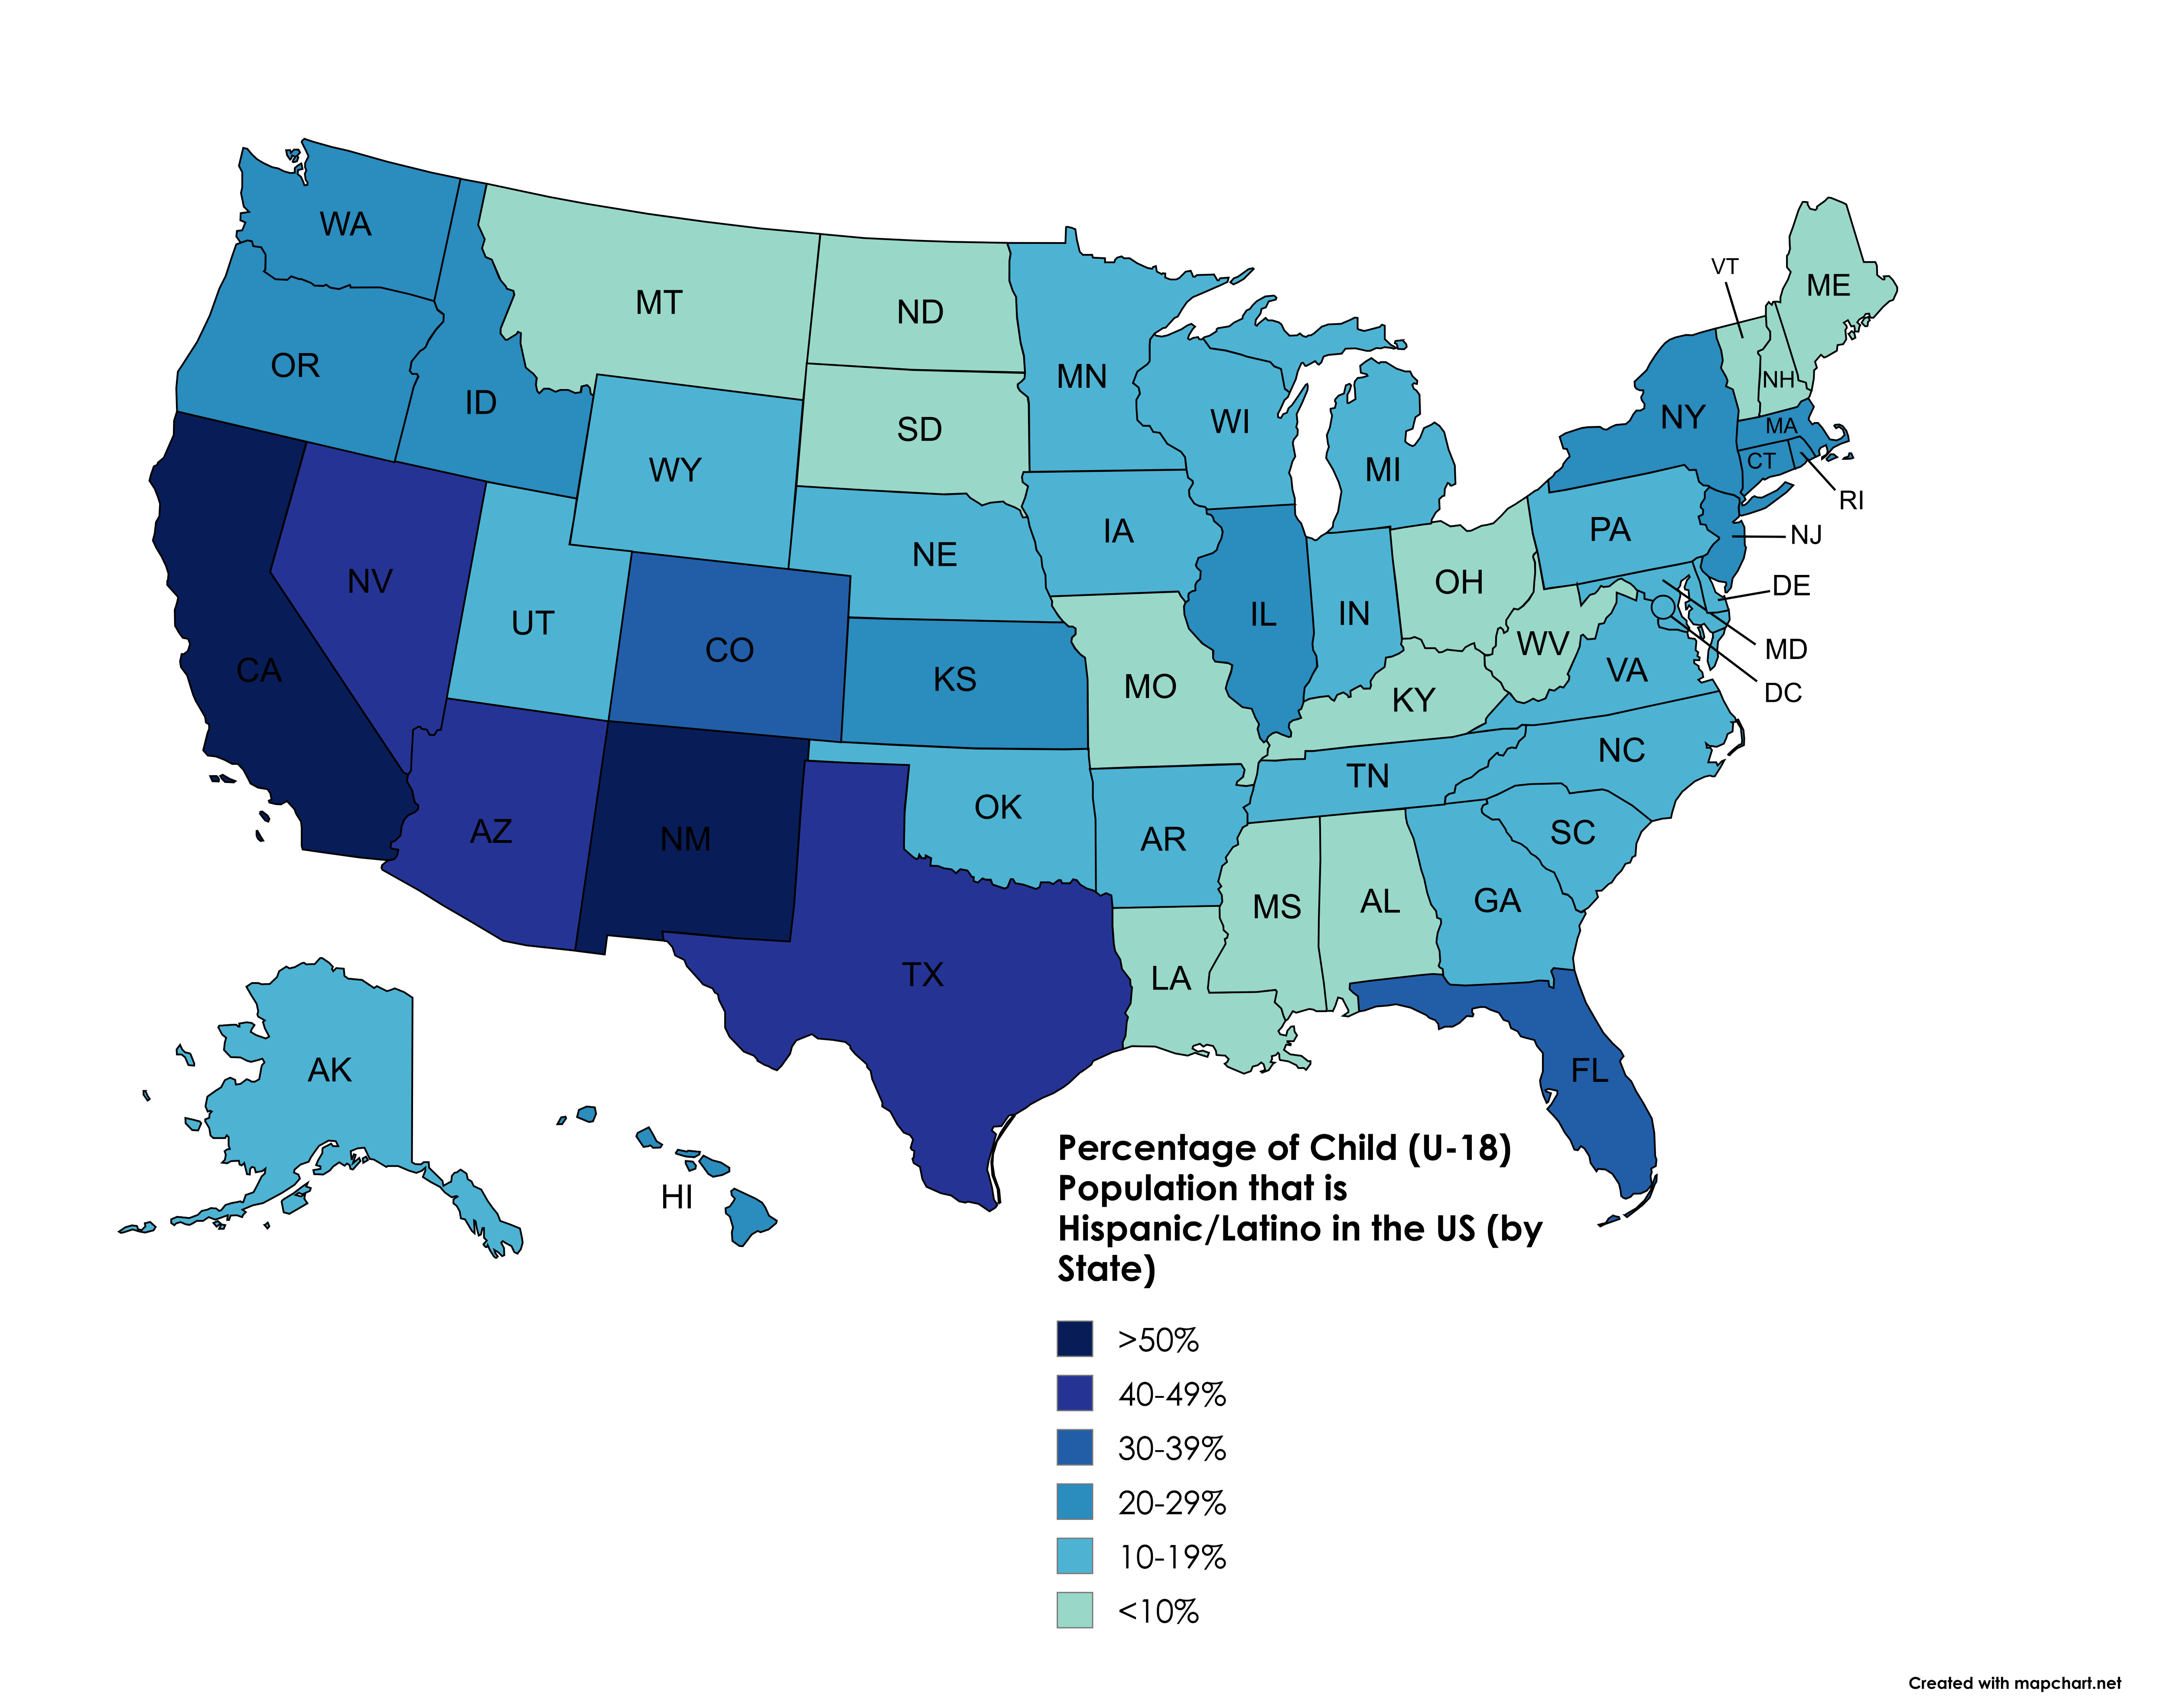
Hispanic/Latino Child Population Percentage Map by State


Alex Cartwright
Senior Cartographer & GIS Specialist
Alex Cartwright is a renowned cartographer and geographic information systems specialist with over 15 years of experience in spatial analysis and data...
Geographic Analysis
What This Map Shows
This map illustrates the percentage of the child population under the age of 18 that identifies as Hispanic or Latino across various states in the U.S. It provides a visual representation of demographic distribution, allowing us to see where Hispanic or Latino children are concentrated in the country. Understanding these patterns is essential for recognizing how cultural and ethnic diversity shapes communities and influences social dynamics in different regions.
Deep Dive into Hispanic/Latino Child Demographics
The Hispanic or Latino population in the United States has been growing rapidly over the past few decades. According to the U.S. Census Bureau, as of 2020, nearly 19% of the total U.S. population identified as Hispanic or Latino, with a significant proportion being children under 18. This demographic is not just a statistic; it represents a rich tapestry of cultures, languages, and experiences that contribute to the social fabric of the nation.
One of the key factors driving the increase in the Hispanic/Latino child population is immigration, coupled with higher birth rates compared to other demographic groups. This growth has profound implications for education, healthcare, and community services. For instance, states with a higher percentage of Hispanic or Latino children often face unique challenges and opportunities within their educational systems. These children may require bilingual education programs and culturally relevant curricula to ensure they receive the best possible support.
Interestingly, states such as California, Texas, and Florida stand out on the map with some of the highest percentages of Hispanic or Latino children. In California, for instance, nearly 50% of the child population identifies as Hispanic or Latino. This is largely due to the state’s historical and geographic ties to Latin America, as well as ongoing immigration trends. Texas, with its burgeoning urban centers like Houston and San Antonio, also showcases a rich Hispanic heritage that influences local culture, cuisine, and community life.
Shifting to regions with lower percentages, states such as Vermont and Maine have significantly smaller Hispanic or Latino child populations, often reflecting historical settlement patterns and the demographic makeup of these states. This variation can spark interesting discussions about integration, representation, and the availability of resources in these less diverse areas. In many cases, these states may lack the infrastructure or community programs to support a growing Hispanic population, should demographic trends shift in the future.
Regional Analysis
When we break down the map regionally, we can see distinct trends. The West and Southwest regions, including states like Arizona and Nevada, display some of the highest percentages of Hispanic or Latino children. This aligns with historical migration patterns, agricultural job opportunities, and the establishment of vibrant Hispanic communities.
Conversely, the Northeast tends to have a more varied profile. While states like New York have significant urban Hispanic populations, rural areas might show lower percentages. This contrast can often lead to differing community needs and resources, where urban centers may invest heavily in bilingual education while rural areas might struggle to provide adequate support.
The Midwest is also an interesting case. States such as Illinois feature large Hispanic populations, particularly in cities like Chicago, reflecting migration patterns from both the Southwest and from Puerto Rico. In contrast, states like North Dakota have much lower percentages, illustrating how geographic and economic factors influence demographic distribution.
Significance and Impact
Understanding the percentage of Hispanic or Latino children by state is crucial for several reasons. First and foremost, it highlights the growing diversity within the U.S., which has implications for policymaking, education, and community development. As the Hispanic population continues to grow, so too does the importance of integrating cultural competency into public services and educational programs.
Moreover, this demographic shift plays a role in shaping the future workforce. Businesses and organizations need to adapt to this changing landscape, recognizing that engaging with diverse communities can foster innovation and growth. As these children grow into adults, their cultural perspectives and experiences will significantly influence the economy and society as a whole.
In light of current trends, we can expect that the Hispanic/Latino child population will continue to grow, especially in states that currently report higher percentages. It’s essential for stakeholders in education, healthcare, and community services to recognize these shifts and prepare accordingly. By doing so, we can ensure that all children, regardless of their background, have the opportunity to thrive and contribute to the social and economic fabric of the nation.
Visualization Details
- Published
- August 8, 2025
- Views
- 122
Comments
Loading comments...