Interactive Map Reveals Regional Variations in 'Wanna' Usage Across the US

David Chen
Data Visualization Specialist
David Chen is an expert in transforming complex geographic datasets into compelling visual narratives. He combines his background in computer science ...
Geographic Analysis
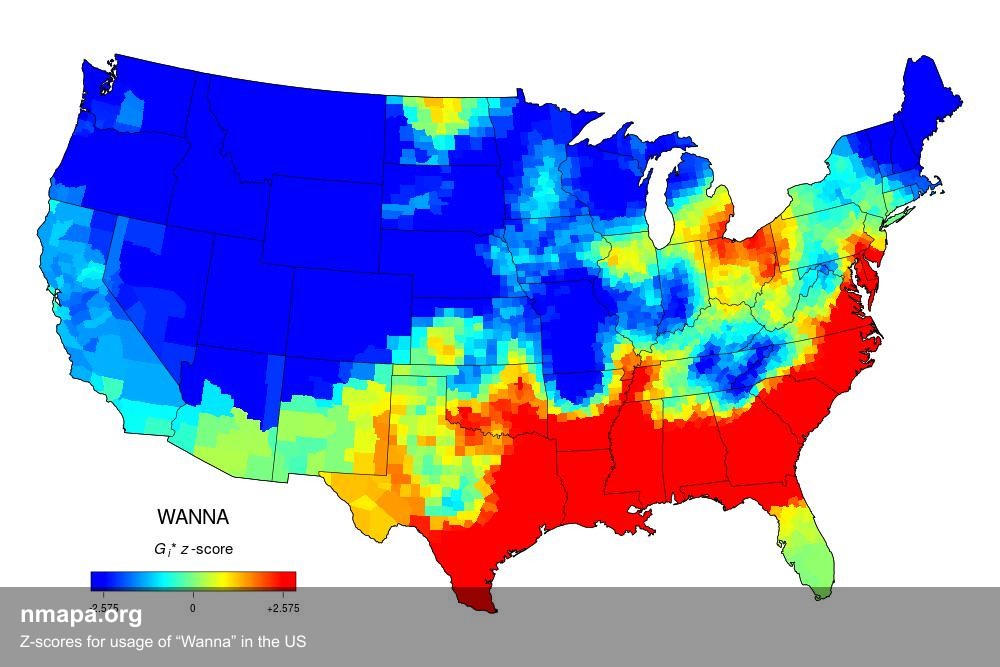
The geographical visualization titled 'Z-scores for usage of “Wanna” in the US' offers a fascinating exploration of regional linguistic patterns across the United States. This interactive map, developed using cutting-edge mapping technology, showcases the varying frequencies of the colloquial term 'wanna,' a contraction of 'want to,' highlighting areas where its usage is particularly prevalent or less common. Utilized primarily in informal speech, the map presents a nuanced perspective on how language evolves differently across diverse locales.
At first glance, the map features a spectrum of colors, with red indicating regions where 'wanna' is used significantly more than the national average, while blue represents areas of lower usage. It's important to clarify that the blue regions are not devoid of the term but rather use it less frequently compared to their red counterparts. This distinction is crucial in understanding the map's implications, as it invites deeper analysis of local dialects and cultural influences.
Geographically, the significance of this visualization lies in its ability to reflect sociolinguistic trends influenced by various factors, including migration patterns, cultural heritage, and even economic conditions. For instance, areas with a high concentration of younger populations or urban centers may exhibit a higher prevalence of informal speech, including terms like 'wanna.' Meanwhile, rural or older demographics may lean towards more traditional speech patterns, resulting in lower usage rates.
Historically, the term 'wanna' has roots in American English, gaining traction during the mid-20th century as conversational speech became increasingly casual. Its usage has since been shaped by media, social networks, and regional dialects, making this map a valuable tool for understanding how modern communication evolves over time.
When analyzing regional patterns, several insights emerge. For example, states in the Southern U.S., characterized by their rich cultural tapestry and informal speech tendencies, show higher usage of 'wanna.' In contrast, regions in the Northeast tend to display a more restrained approach to colloquialisms, as evidenced by the map's blue hues. This discrepancy not only highlights linguistic diversity but also opens discussions about cultural identity and social norms within different American communities.
The educational value of this type of visualization cannot be overstated. It serves as a gateway for viewers to learn about the intersection of language and geography, illustrating how dialects and speech patterns can vary dramatically even within relatively close proximity. By engaging with the map, individuals can develop a greater appreciation for the complexity of human communication and the factors that influence it.
Moreover, this visualization contributes to broader geographical concepts such as regionalism and sociolinguistics. It encourages viewers to consider how language serves as a cultural marker that can signify belonging, identity, and social affiliation. Understanding these nuances can enrich discussions around migration, globalization, and the dynamic nature of language.
In conclusion, the 'Z-scores for usage of “Wanna” in the US' map is not merely a representation of linguistic data; it is a vibrant illustration of the cultural and regional diversity that defines the United States. By examining the geographical distribution of 'wanna' usage, we gain insights into the evolving tapestry of American English, sparking curiosity and encouraging further exploration within the fields of geography and linguistics. Whether you're a language enthusiast, a geography aficionado, or simply someone curious about the world around you, this map serves as an engaging educational resource that highlights the intricate connections between language, culture, and geography.
Visualization Details
- Published
- August 1, 2025
- Views
- 126
Comments
Loading comments...