state analysis Maps
6 geographic visualizations tagged with "state analysis"
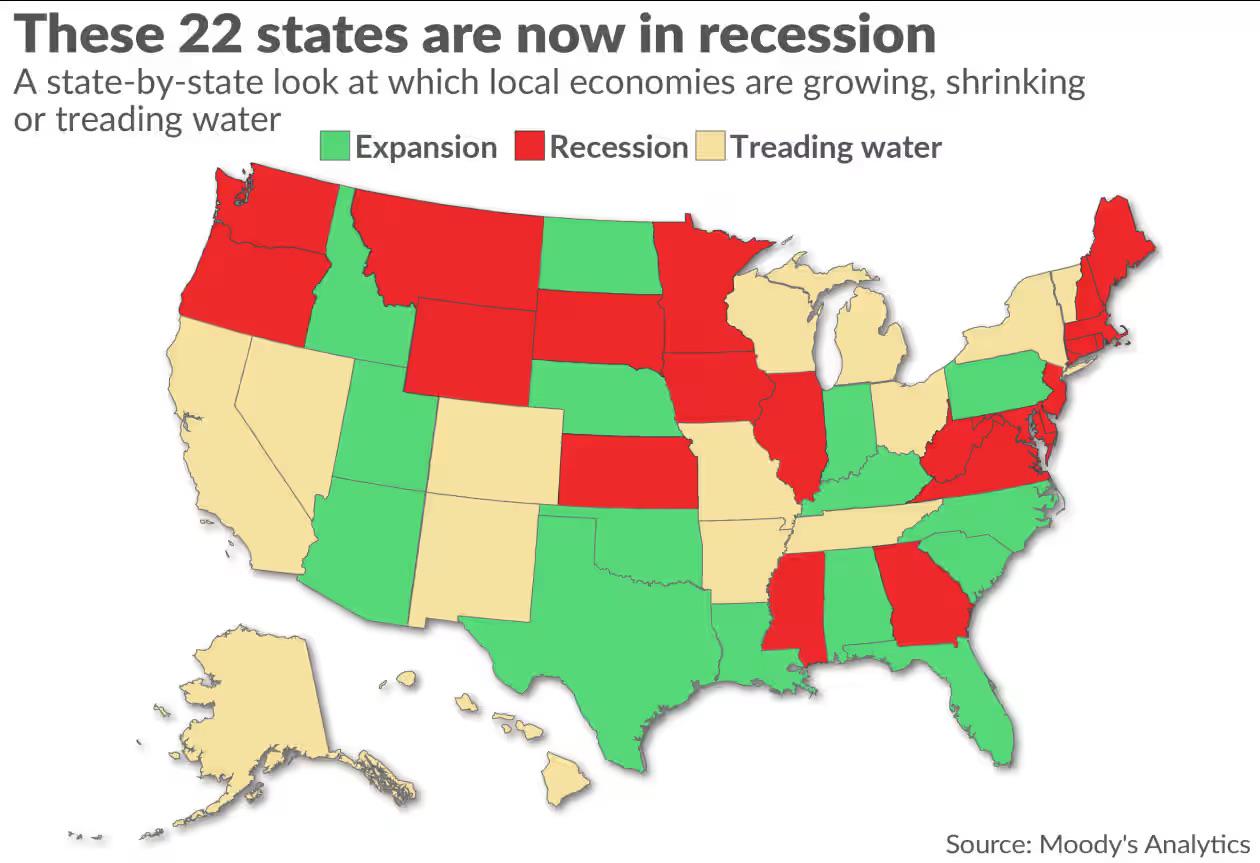
Recession States Map of America as of October 2025
This map provides a visual representation of the American states that are currently experiencing economic recession as o...
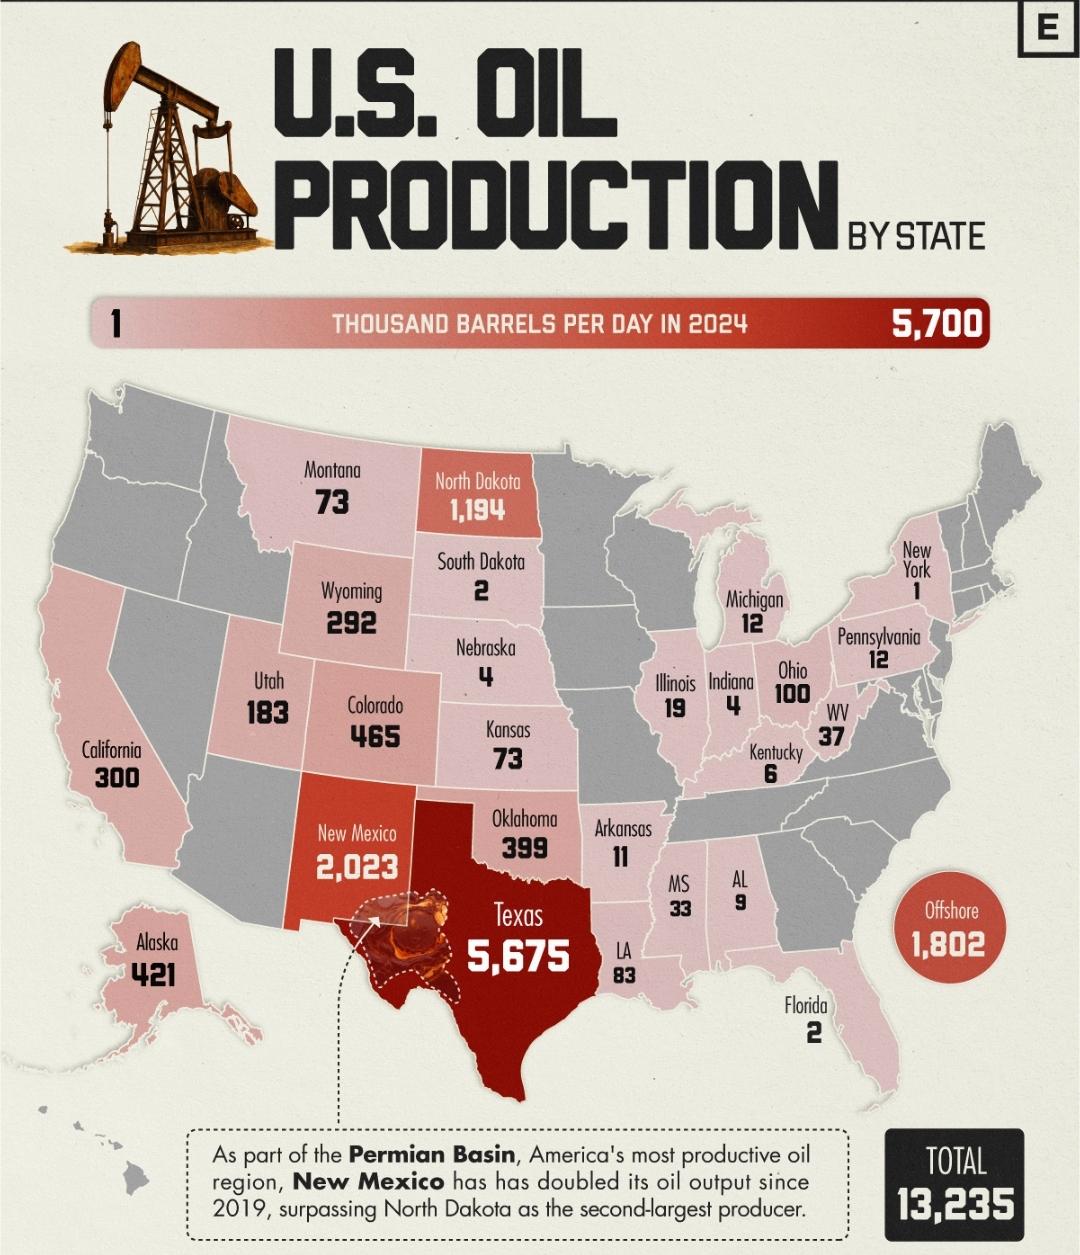
US Oil Production by State Map
The "US Oil Production by State" map provides a visual representation of the oil production levels across the United Sta...
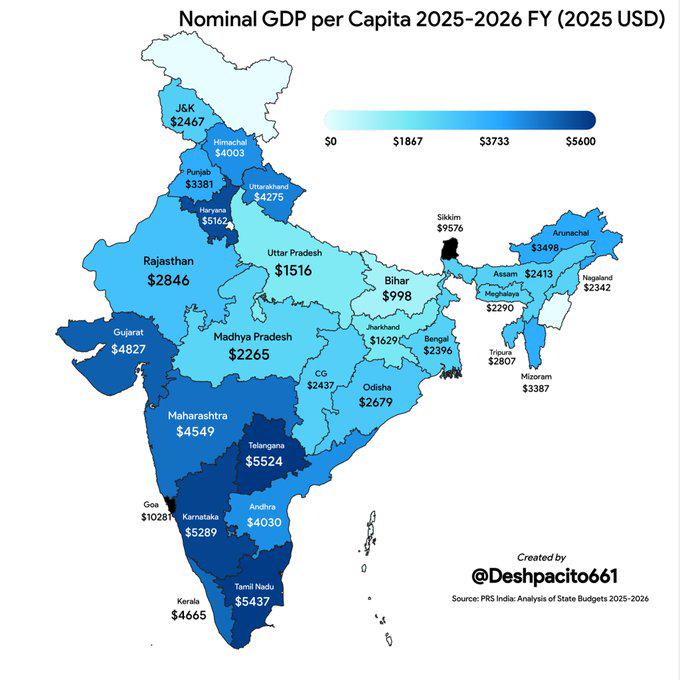
India Nominal GDP per Capita by State Map
The visualization titled "India Nominal GDP per Capita for States 2025-2026 FY (2025 USD)" presents a detailed overview ...
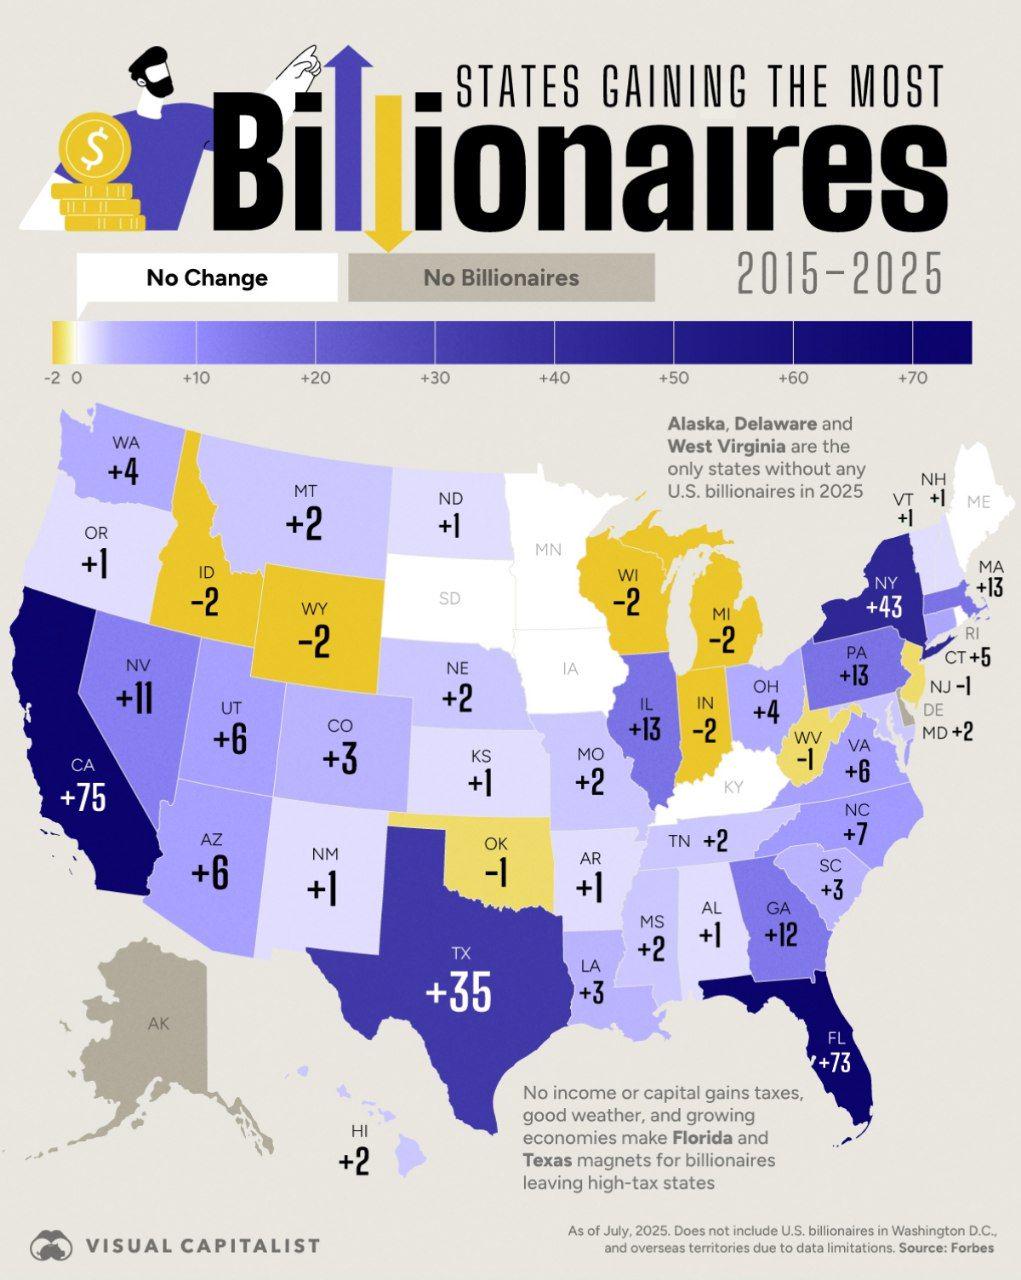
Map of States Gaining the Most Billionaires
The visualization titled "States Gaining the Most Billionaires" illustrates the rapidly changing landscape of wealth dis...
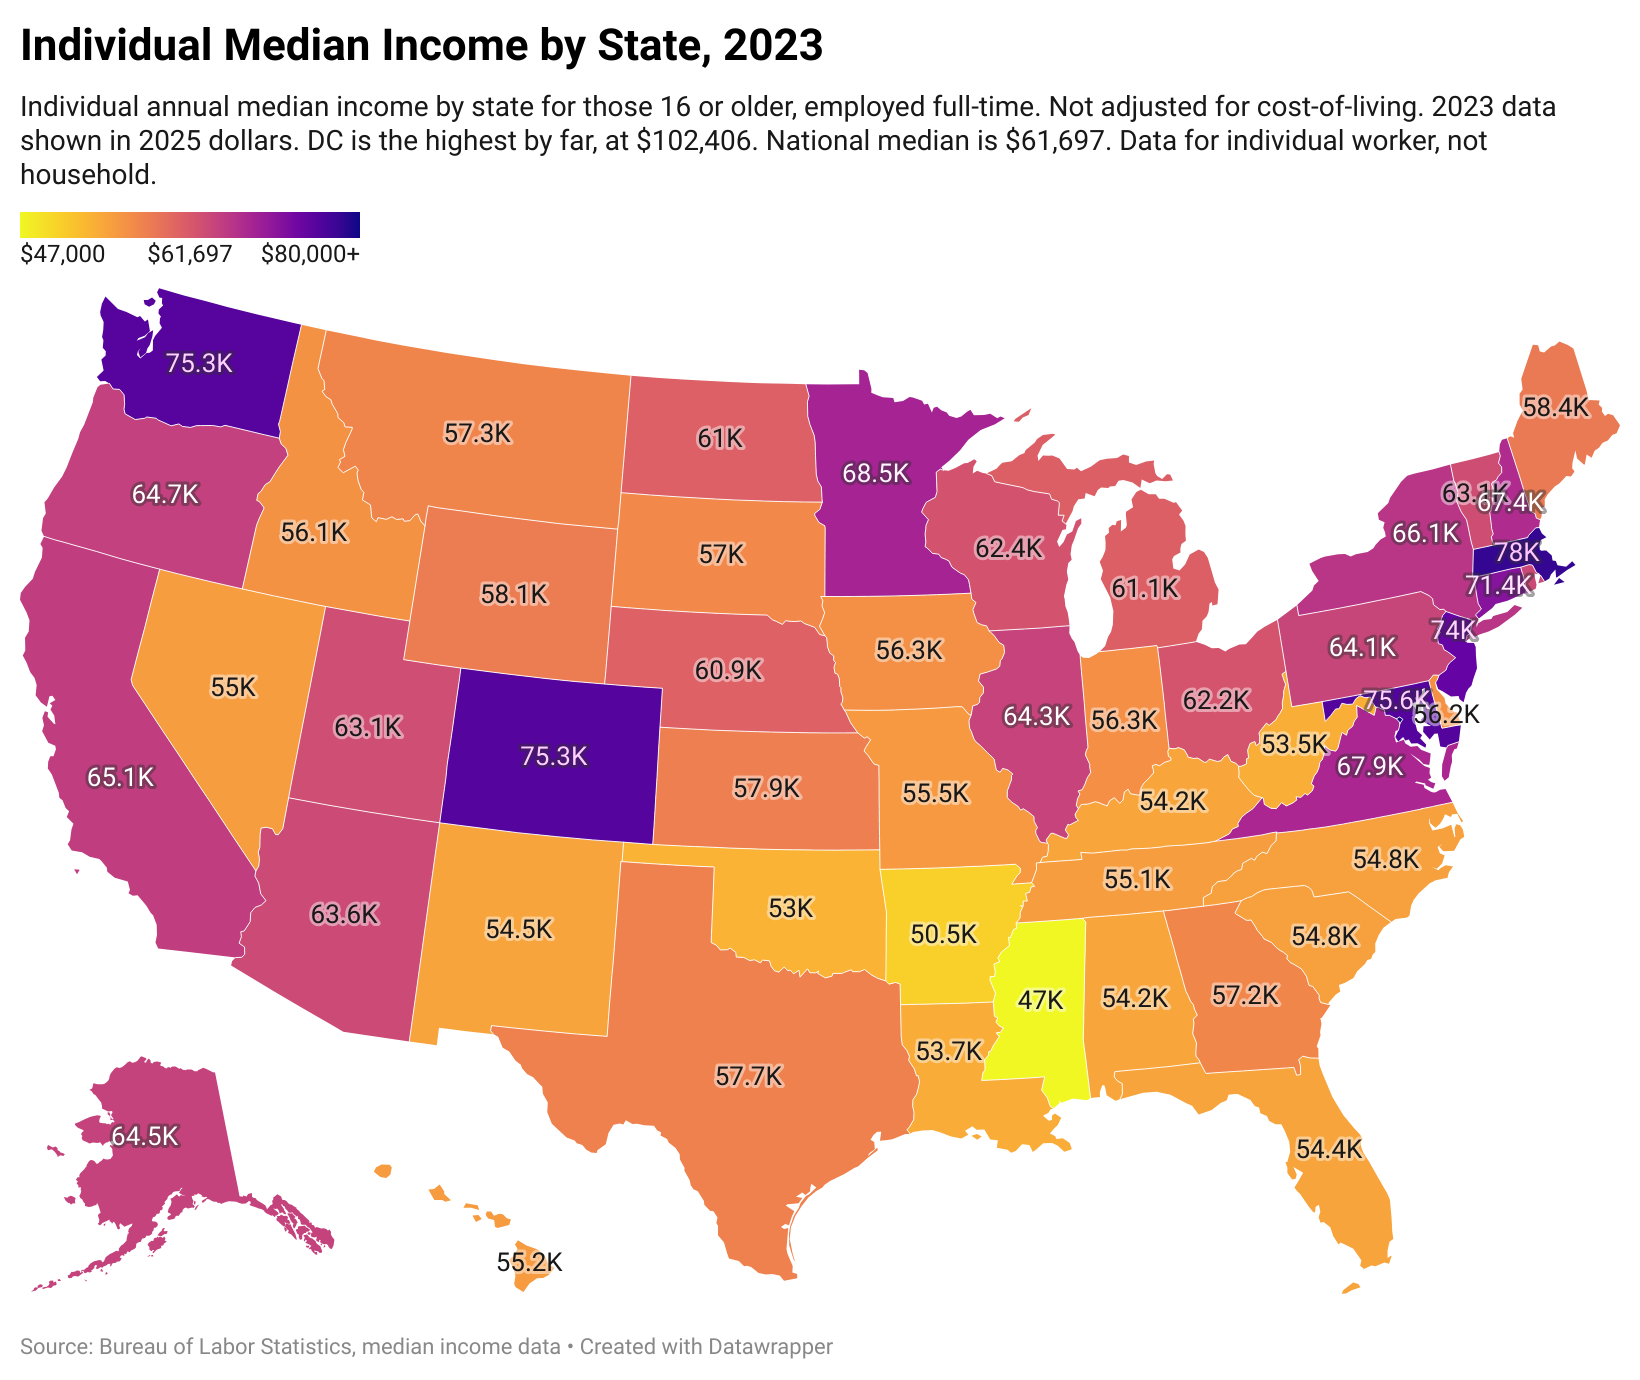
Individual Median Income by State Map 2023
The visualization titled "Individual Median Income by State, 2023" presents a detailed look at the median income levels ...
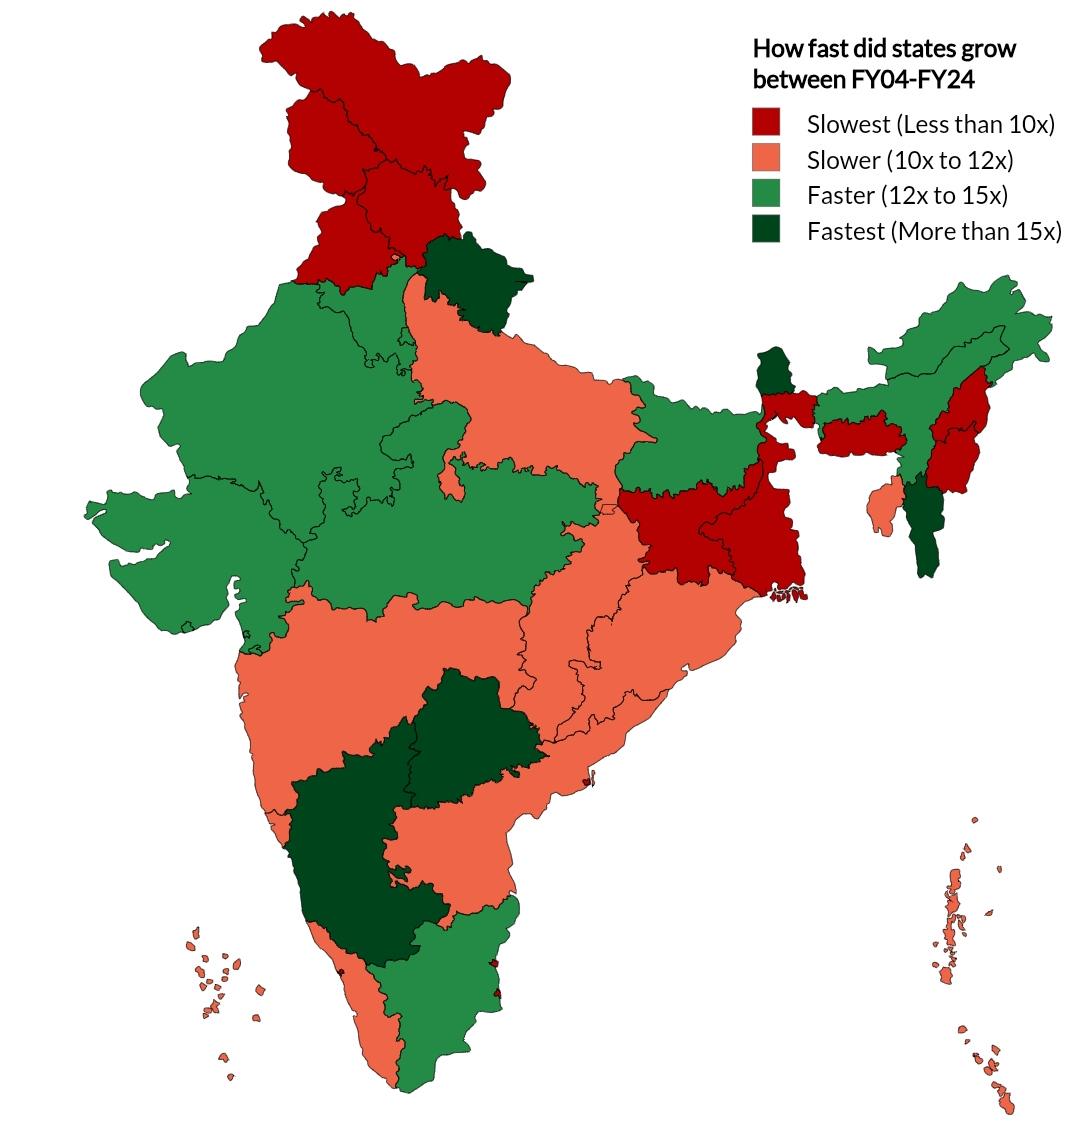
Indian States GDP Growth Map Over Two Decades
The map titled "How fast did Indian states grow in past two decades" provides a compelling visual representation of the ...