Individual Median Income by State Map 2023

Alex Cartwright
Senior Cartographer & GIS Specialist
Alex Cartwright is a renowned cartographer and geographic information systems specialist with over 15 years of experience in spatial analysis and data...
Geographic Analysis
What This Map Shows
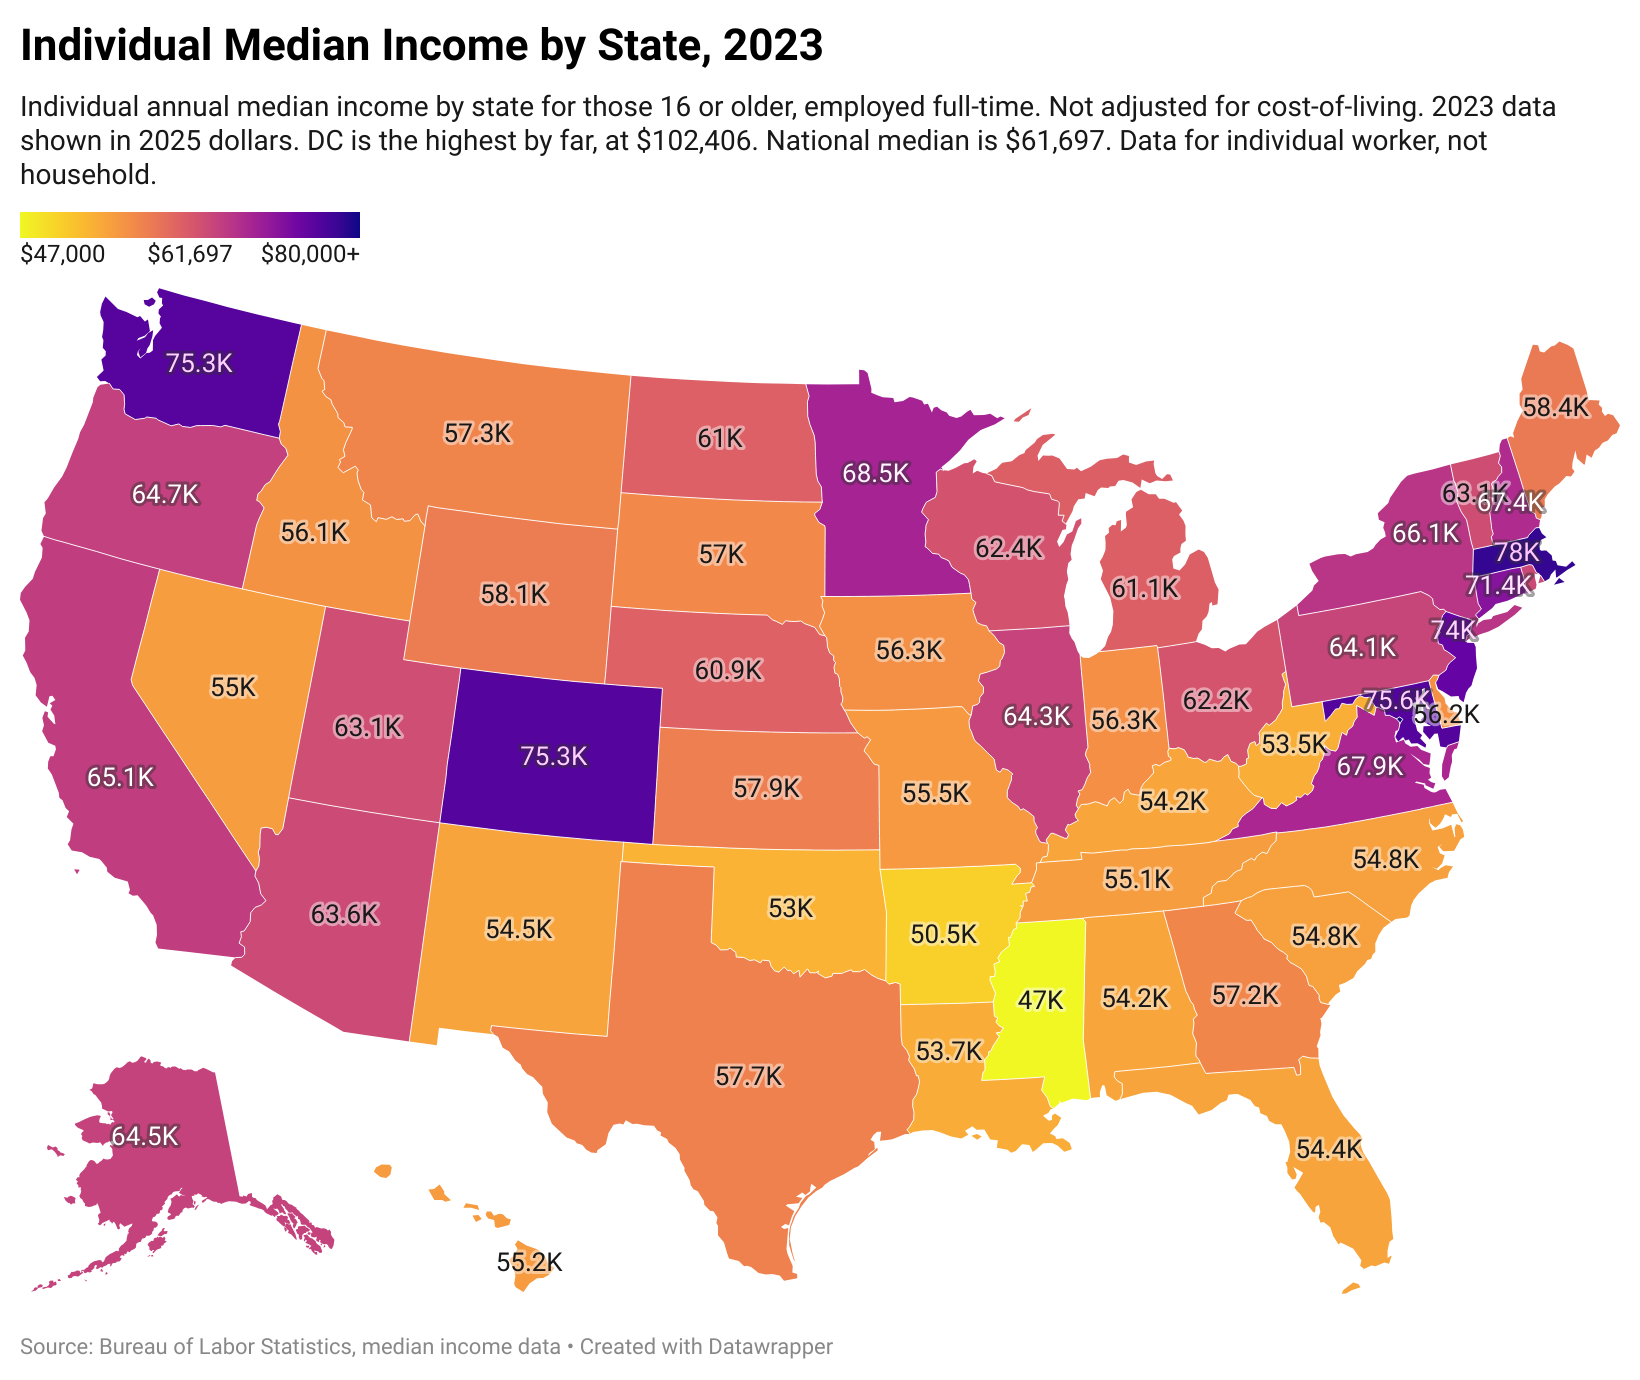
The visualization titled "Individual Median Income by State, 2023" presents a detailed look at the median income levels for full-time workers across the United States. This data, extracted from the Bureau of Labor Statistics, offers insights into how earnings vary from state to state, providing a snapshot of economic health and employment conditions across the nation. Interestingly, even though the report highlights women’s earnings, the table referenced includes all workers, making this map a valuable resource for understanding the broader workforce landscape.
Deep Dive into Individual Median Income
Individual median income is a critical indicator of economic well-being, reflecting not just the earning potential of individuals but also broader economic trends and labor market conditions. This metric is particularly vital for assessing the financial stability of households and the purchasing power of workers in different regions.
The median income is defined as the middle point of income distribution; half of the workers earn less, and half earn more. This measurement can be more informative than average income, as it is less affected by extreme values, such as extremely high earners. For instance, states like California and New York, known for their high cost of living and significant income disparity, may show inflated average incomes due to a small number of very high earners. However, the median income offers a clearer picture of what the average worker can expect to earn in these states.
According to the data for 2023, states like Massachusetts and Washington lead the pack with the highest median incomes, reflecting thriving economies driven by technology, finance, and education. In contrast, states such as Mississippi and West Virginia show lower median incomes, highlighting ongoing economic challenges and disparities.
What’s fascinating is how regional industries influence these income levels. For example, states with robust technology sectors, like California and Texas, typically report higher median incomes due to the demand for skilled labor. In contrast, states with economies reliant on agriculture or manufacturing may have lower median incomes, reflecting the wage structures within those industries.
Moreover, the impact of education cannot be overlooked. Higher educational attainment often leads to higher-paying jobs. States with a higher percentage of college graduates tend to report higher median incomes, as seen in places like Maryland and Virginia. This correlation underscores the importance of education and training in shaping the income landscape.
Regional Analysis
When examining the map, distinct regional patterns emerge. The Northeast, particularly states like Massachusetts and New York, showcases some of the highest median incomes, driven by industries such as finance, healthcare, and technology. On the other hand, the Southeast generally reports lower median incomes, with states like Alabama and Mississippi at the lower end of the spectrum, often due to economic reliance on sectors that traditionally pay less.
In the Midwest, states like Illinois and Minnesota show a mixed bag, with median incomes that reflect both urban centers with high wages and rural areas with lower earnings. Interestingly, states in the West, such as Colorado and Washington, balance the high incomes of metropolitan areas with the lower incomes found in more rural parts of the region.
The Southwest presents another intriguing case, where states like Arizona and New Mexico show moderate median incomes, influenced by tourism and service industries. However, these states also face challenges with poverty rates, which can skew perceptions of economic health.
Significance and Impact
Understanding median income by state is crucial for several reasons. It not only informs potential workers about where they might find better-paying jobs but also helps policymakers identify regions that may need economic intervention or support. Furthermore, it provides insight into the overall economic health of states, guiding investment decisions and economic development initiatives.
As we look toward future projections, it’s essential to consider how shifts in technology, remote work, and globalization may further affect income distribution. For instance, the rise of remote work has the potential to equalize income disparities, allowing workers in lower-income states to access higher-paying jobs without the need to relocate. However, this trend may also deepen existing divides if not all workers have equal access to technology and training.
In conclusion, the "Individual Median Income by State, 2023" map serves as a powerful tool for understanding economic dynamics across the U.S. It reflects not only the earning potential of individuals but also the broader forces shaping our economy. As we continue to navigate these complexities, this data will remain vital for informed decision-making at all levels of society.
Visualization Details
- Published
- September 1, 2025
- Views
- 82
Comments
Loading comments...