US Oil Production by State Map

David Chen
Data Visualization Specialist
David Chen is an expert in transforming complex geographic datasets into compelling visual narratives. He combines his background in computer science ...
Geographic Analysis
What This Map Shows
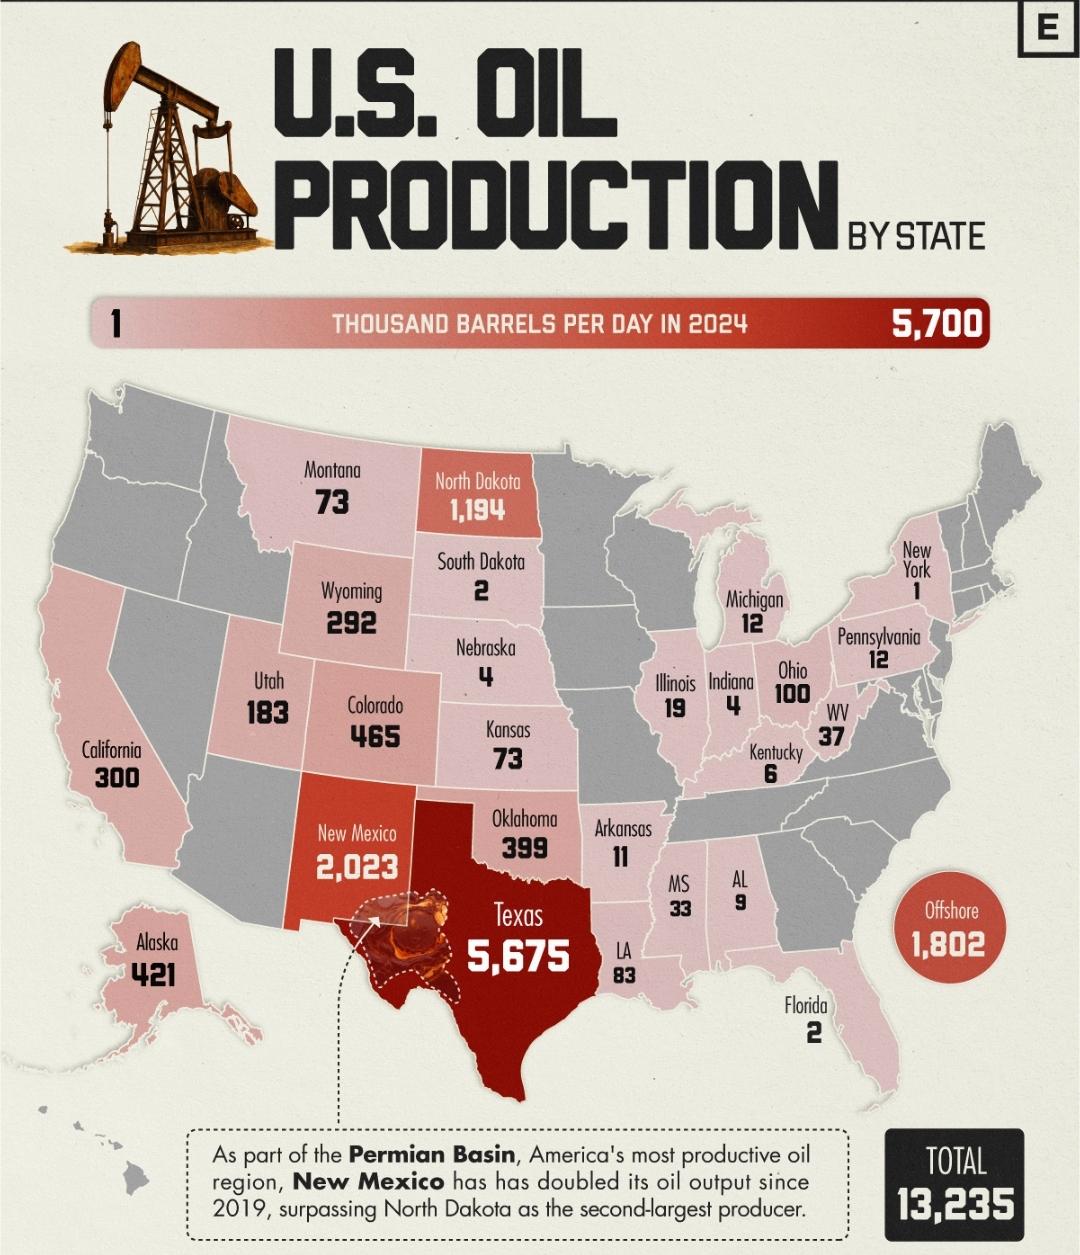
The "US Oil Production by State" map provides a visual representation of the oil production levels across the United States, highlighting the states that are leading in oil extraction and those with minimal output. Through this map, we can easily identify the major players in the oil industry, allowing for a clearer understanding of how energy resources are distributed throughout the country. This visualization serves not only as a snapshot of current production levels but also as a reflection of economic activities, geopolitical implications, and environmental considerations surrounding oil production.
Deep Dive into Oil Production in the US
Oil production in the United States has a rich history that dates back to the mid-19th century when the first commercial oil well was drilled in Pennsylvania. Over the decades, the US has evolved into one of the world’s top oil producers, thanks in part to technological advancements in drilling methods, such as hydraulic fracturing and horizontal drilling. Currently, the US is a leading producer alongside countries like Saudi Arabia and Russia.
Interestingly, the map reveals that Texas is by far the largest oil producer in the nation, accounting for approximately 40% of the total US oil production. This is largely due to the vast reserves located in the Permian Basin, where both traditional and unconventional drilling techniques have unlocked significant amounts of crude oil. Other notable states include North Dakota, which has seen a dramatic increase in production due to the Bakken formation, and New Mexico, which has also benefited from the Permian Basin.
Have you noticed how oil production correlates with geographical features? States like Alaska, with its remote wilderness, have their own unique production challenges and opportunities. The North Slope, for instance, has significant oil reserves, yet extreme weather conditions complicate extraction efforts.
Moreover, oil production heavily influences local economies. States with high production levels often see a surge in jobs, investments, and technology development. For example, the oil boom in North Dakota led to rapid population growth and infrastructural development, transforming small towns into bustling communities almost overnight. However, it has also raised concerns about sustainability, environmental degradation, and the social implications of a boom-and-bust economy.
Regional Analysis
When examining the map in a regional context, it's fascinating to see how oil production varies across the country. In the West, states like California have historically had strong production levels due to both onshore and offshore drilling. However, California's stringent environmental regulations have led to a decline in production in recent years.
Moving towards the Midwest, North Dakota stands out as a significant player, thanks to the shale revolution. The Bakken formation has transformed the state into a vital contributor to US oil output, showcasing the impact of modern extraction technologies. In contrast, states like Ohio and Pennsylvania, though rich in natural gas through the Utica and Marcellus shales, still lag behind in oil production.
In the Gulf Coast region, Louisiana and Texas dominate the map, benefiting from their access to both resources and infrastructure, such as refineries and pipelines. This region serves as a critical hub for oil distribution and export, influencing national prices and economic conditions.
Significance and Impact
Understanding oil production by state is crucial for several reasons. Firstly, it directly affects the nation’s economy, energy security, and employment rates. As the US continues to shift towards a more energy-independent future, the implications of oil production extend into international relations and policy-making. Countries that rely heavily on oil imports must navigate the complexities of fluctuating prices and supply disruptions, often influenced by US production levels.
Interestingly, the focus on renewable energy sources is reshaping the conversation around oil production. As environmental concerns rise, many states are beginning to pivot towards sustainable energy practices. This transition could lead to decreased oil dependency, impacting both production levels and state economies in the long term.
Looking ahead, projections indicate that while oil production may stabilize, the integration of new technologies and shifting policies will play a pivotal role in shaping the industry's future. Will the US maintain its status as a leading oil producer as the world increasingly embraces green energy? The answer to that question may depend on how states adapt to changing market demands and environmental challenges.
In conclusion, the "US Oil Production by State" map isn't just a representation of numbers; it's a reflection of the intricate relationships between geography, economy, and environment. As we continue to navigate the complexities of energy production, this map serves as a vital tool for understanding the dynamics at play in one of the most significant industries in the world.
Visualization Details
- Published
- October 3, 2025
- Views
- 54
Comments
Loading comments...