historical data Maps
3 geographic visualizations tagged with "historical data"

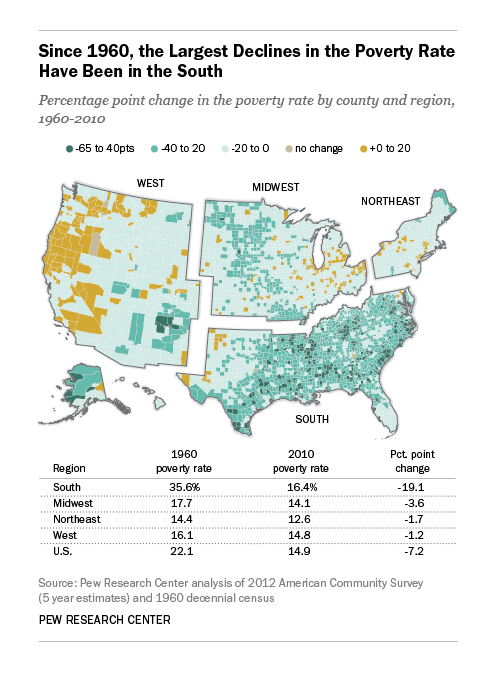
US Poverty Rate Decline Map 1960-2010
The "Decline in the US Poverty Rate 1960-2010" map provides a visual representation of how poverty levels have changed a...
👁 8📅 10/30/2025

Average Height of East Asian Men in the 1920s Map
The visualization titled \...
👁 24📅 10/18/2025

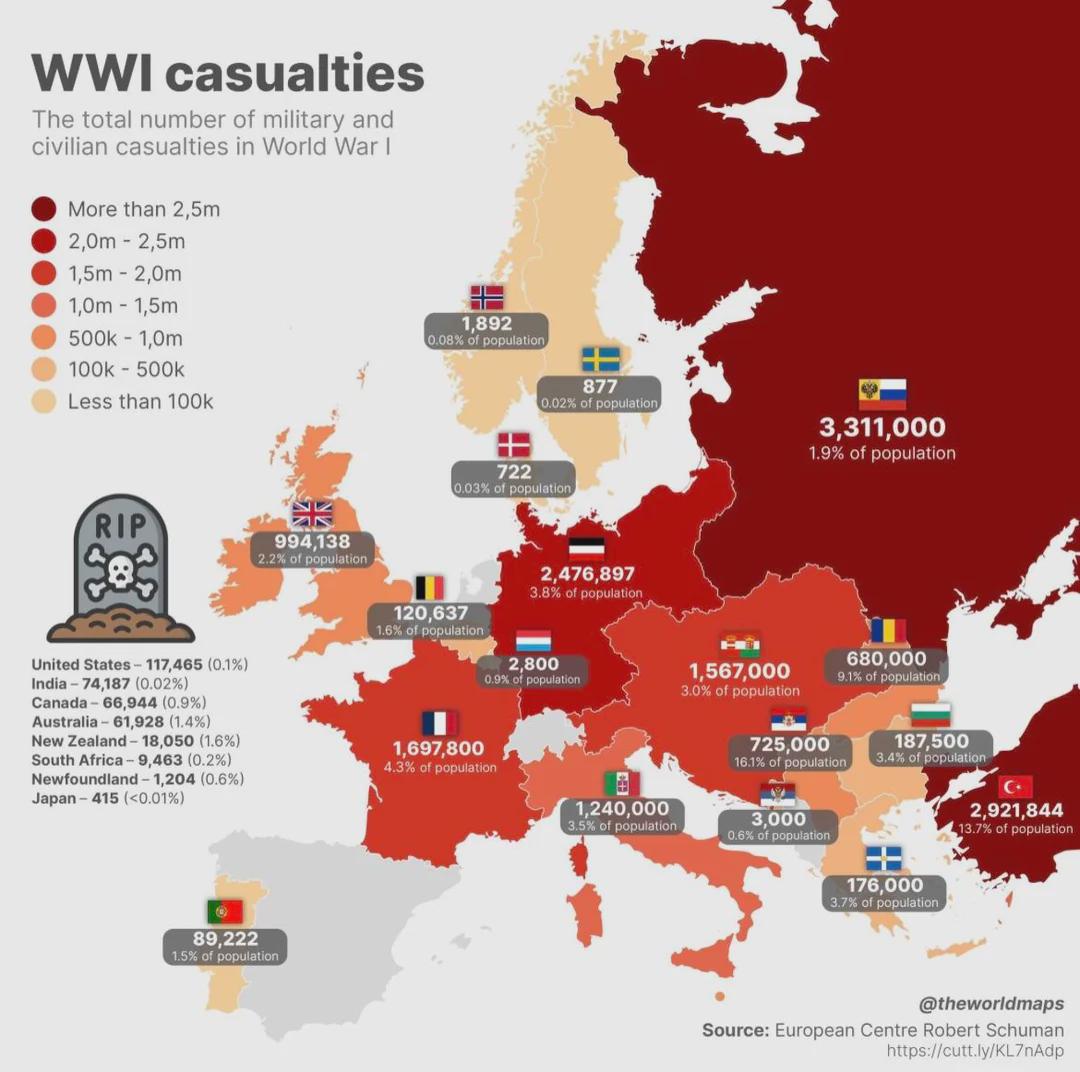
First World War Casualties Mapped
The "First World War Casualties Mapped" visualization provides a comprehensive overview of military and civilian casualt...
👁 60📅 10/10/2025