US Poverty Rate Decline Map 1960-2010

Marcus Rodriguez
Historical Geography Expert
Marcus Rodriguez specializes in historical cartography and geographic data analysis. With a background in both history and geography, he brings unique...
Geographic Analysis
What This Map Shows
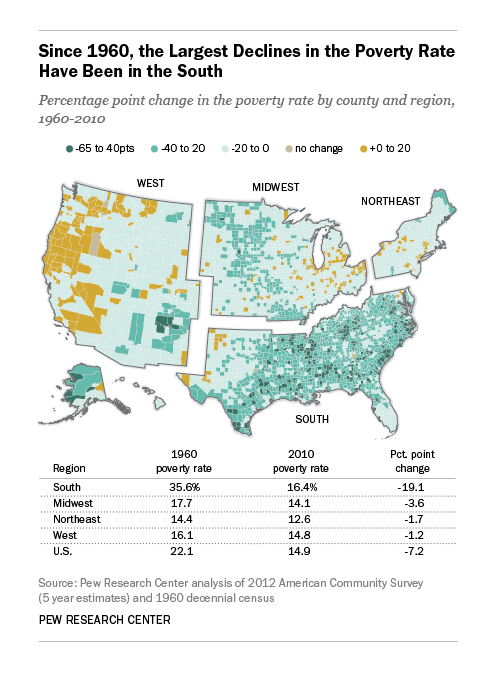
The "Decline in the US Poverty Rate 1960-2010" map provides a visual representation of how poverty levels have changed across various states over a five-decade period. This map highlights the percentage of the population living below the official poverty line, which is determined by the federal government. As you observe the gradual decline in poverty rates, it’s essential to delve into the underlying factors and the socio-economic context that contributed to these changes.
Deep Dive into Poverty in the United States
Poverty is a complex issue that encompasses not just a lack of income, but also limited access to education, healthcare, and job opportunities. Over the years, the poverty rate in the United States has seen significant fluctuations influenced by various economic, social, and political factors. Interestingly, the overall trend from 1960 to 2010 indicates a gradual decline in poverty rates, from around 22% in 1960 to approximately 15% in 2010. However, this decline was not uniform across the nation.
One of the most notable factors leading to the decline in poverty levels has been economic growth, particularly during the latter half of the 20th century. The post-World War II boom created ample job opportunities, lifting many families out of poverty. Additionally, the introduction of various social welfare programs, such as Medicare and Medicaid in the 1960s and the expansion of food assistance programs, played a crucial role in supporting low-income households.
Furthermore, changes in demographics and family structures also influenced poverty trends. The increasing participation of women in the workforce contributed to higher household incomes, which helped many families escape poverty. However, it’s essential to note that while the national poverty rate declined, certain demographic groups, particularly racial minorities and single-parent households, experienced persistent poverty rates, highlighting the inequities that still exist.
The late 2000s brought about the Great Recession, which posed significant challenges to the poverty rate. The economic downturn led to job losses and increased unemployment, causing a temporary spike in poverty levels. However, the resilience displayed by various communities and the subsequent recovery efforts have contributed to a slow but steady decline post-2010.
Regional Analysis
When we break down the map by regions, it becomes evident that the decline in poverty rates was not uniform across the United States. For instance, states in the Northeast and West Coast, such as Massachusetts and California, generally experienced more significant decreases in poverty rates compared to Southern and Midwestern states.
In states like Mississippi and Arkansas, poverty rates remained stubbornly high, often exceeding 20% even as national averages fell. These areas often grapple with systemic issues, including lower educational attainment, limited access to healthcare, and fewer job opportunities in emerging industries. Conversely, states like New York and New Jersey benefitted from a diverse economy and higher educational attainment, leading to more significant economic mobility and a reduction in poverty rates.
Interestingly, the urban-rural divide also plays a significant role in understanding these regional disparities. Urban areas typically show lower poverty rates due to better job availability and access to services, while rural areas struggle with economic stagnation and higher poverty levels. For example, while metropolitan areas in Texas saw declines in poverty, rural parts of the state faced persistent poverty due to a lack of infrastructure and job opportunities.
Significance and Impact
Understanding the trends in poverty rates is crucial for shaping policy and addressing the needs of vulnerable populations. The decline in the poverty rate from 1960 to 2010 demonstrates that effective social programs and economic policies can lead to tangible improvements in people's lives. However, it also highlights the ongoing challenges faced by marginalized communities.
The implications of these trends extend beyond mere statistics; they impact education, health outcomes, and overall quality of life. For instance, children growing up in poverty are at a higher risk of facing educational barriers, which can perpetuate the cycle of poverty. As we look toward the future, it’s essential to focus on inclusive economic growth and targeted interventions to support those who continue to struggle.
In conclusion, while the decline in the US poverty rate from 1960 to 2010 is a positive trend, it serves as a reminder of the work that still needs to be done to ensure that all Americans have the opportunity to thrive. With ongoing economic changes and shifting demographics, continuous efforts will be required to address the root causes of poverty and create a more equitable society.
Visualization Details
- Published
- October 30, 2025
- Views
- 0
Comments
Loading comments...