Electric Cost in the United States Map

Alex Cartwright
Senior Cartographer & GIS Specialist
Alex Cartwright is a renowned cartographer and geographic information systems specialist with over 15 years of experience in spatial analysis and data...
Geographic Analysis
What This Map Shows
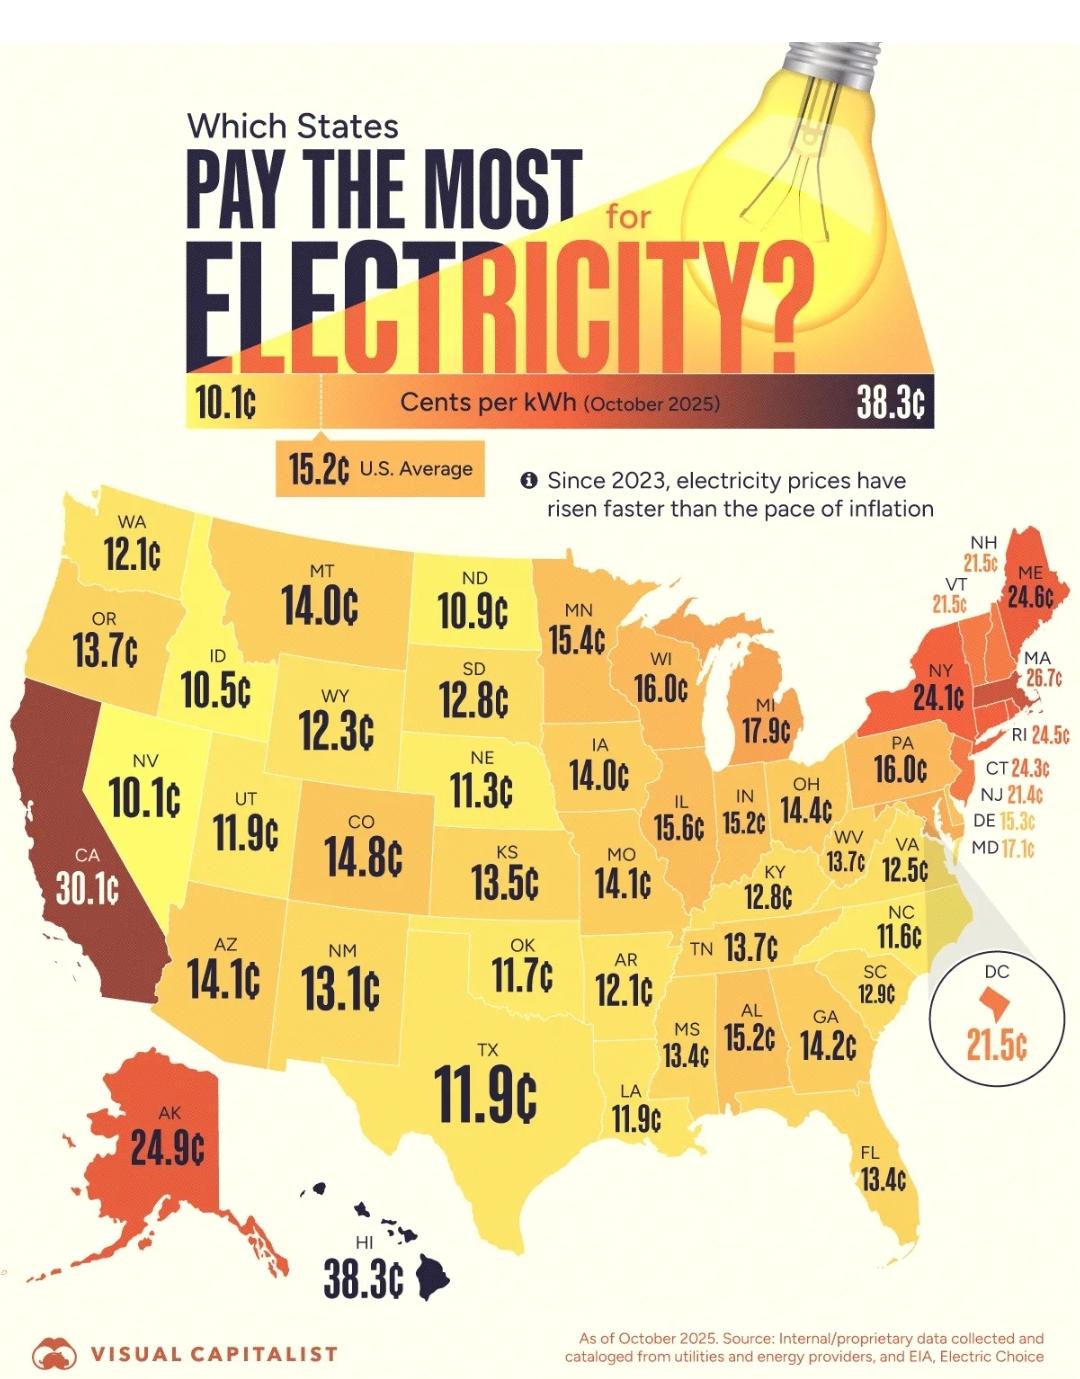
The "Electric Cost in the United States" map provides a comprehensive visualization of electricity prices across different states. This map highlights the average cost of residential electricity in kilowatt-hours (kWh), allowing for easy comparison of energy expenses from one region to another. Understanding these costs is crucial not only for consumers but also for policymakers, businesses, and environmental advocates as they navigate the complexities of energy consumption and sustainability.
Deep Dive into Electric Costs
Electricity prices in the United States vary significantly due to multiple factors including energy sources, state regulations, and infrastructure costs. Interestingly, the U.S. energy grid is a patchwork of different systems and regulations, which leads to these disparities. As of recent data, the national average electricity cost hovers around 13 cents per kWh, but this figure masks a wide range of prices experienced across the country.
For instance, states like Hawaii exhibit the highest rates, often exceeding 30 cents per kWh, primarily because they rely heavily on imported fossil fuels and have limited local energy production. On the other hand, states such as Louisiana and Washington enjoy some of the lowest rates, often below 10 cents per kWh. Louisiana benefits from abundant natural gas resources, while Washington's low rates are largely due to its extensive hydropower generation capabilities.
Electricity costs are influenced by the energy mix utilized in each state. States that rely heavily on coal or natural gas often have lower rates due to the established infrastructure and lower extraction costs. Conversely, states investing in renewable energy sources—like wind and solar—might see higher initial costs but can benefit from long-term savings and environmental advantages.
Moreover, the regulatory environment plays a pivotal role in determining electricity prices. States with deregulated electricity markets, such as Texas, allow consumers to choose their electricity providers, which can lead to competitive pricing. However, deregulation can also result in price volatility, making it crucial for consumers to stay informed about market trends.
What's fascinating is the trend toward renewable energy sources. As more states move toward sustainability, the initial costs may rise due to investment in infrastructure and technology. However, over time, these investments can lead to reduced prices and increased energy independence.
Regional Analysis
When analyzing the map regionally, we can observe distinct patterns of electricity costs. The Northeast, for example, typically shows higher average costs due to its reliance on imported energy and aging infrastructure. States like New York and Massachusetts often report rates above the national average, driven by high demand and limited local generation.
In contrast, the Midwest showcases a more balanced approach with a mix of coal, natural gas, and a growing investment in renewables. States like Indiana and Ohio present moderate rates, but as solar and wind projects continue to expand, we may see shifts in these dynamics.
The West Coast, particularly California, is characterized by some of the highest electricity costs in the country. This is primarily due to stringent environmental regulations and a push toward renewable energy. However, the state is also a leader in solar energy, which could help stabilize costs in the future. Meanwhile, neighboring states like Oregon and Washington, with their vast hydropower resources, continue to maintain lower rates.
Interestingly, the South shows a juxtaposition of rates; while states like Texas benefit from low prices due to oil and gas resources, others in the region—like Florida—face higher costs due to a mix of energy sources and regulatory factors.
Significance and Impact
Understanding electricity costs is vital for numerous reasons. For consumers, knowing the average rates can help in budgeting and making informed choices about energy usage or even moving to a different state for lower living expenses. For businesses, electricity costs directly impact operational expenses, influencing decisions about where to locate facilities or invest in renewable energy technologies.
On a broader scale, escalating electricity prices can affect economic growth and energy policies. High costs may drive innovation in energy efficiency and alternative energy, pushing states to adapt to new technologies. Additionally, as climate change becomes a pressing concern, understanding the economics of electricity generation will be crucial in transitioning to a more sustainable energy future.
Looking ahead, trends indicate a gradual shift toward renewable energy sources, which could reshape electricity pricing landscapes. As technology advances and becomes more affordable, we might witness a decrease in costs associated with renewables, enabling more widespread adoption. This could ultimately lead to a more stable and equitable electricity market across the United States, benefiting both consumers and the environment.
In summary, the "Electric Cost in the United States" map is not just a representation of numbers; it tells the story of energy production, consumption, and the ongoing shift toward a more sustainable future.
Visualization Details
- Published
- October 28, 2025
- Views
- 8
Comments
Loading comments...