SNAP Participation by U.S. Congressional District Map

David Chen
Data Visualization Specialist
David Chen is an expert in transforming complex geographic datasets into compelling visual narratives. He combines his background in computer science ...
Geographic Analysis
What This Map Shows
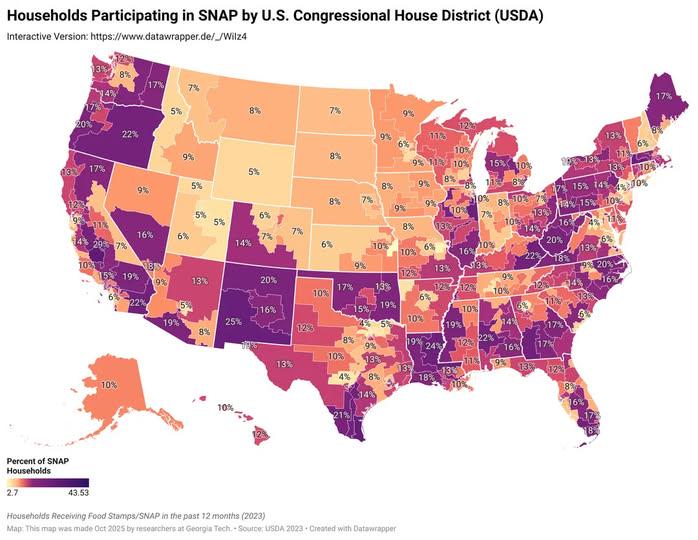
The "Households Participating in SNAP (Food Stamps) by U.S. Congressional House District" map provides a visual representation of the number of households enrolled in the Supplemental Nutrition Assistance Program (SNAP) across various congressional districts in the United States. This program, often referred to as food stamps, serves as a crucial resource for low-income families, offering them assistance in purchasing food. The map highlights the disparities in participation rates, revealing which areas have higher concentrations of households relying on this vital support.
Deep Dive into SNAP Participation
SNAP was established to alleviate hunger and improve nutrition among low-income individuals and families. The program is funded by the federal government but administered by states, which means participation levels can vary significantly from one area to another. Factors influencing these variations include local economic conditions, unemployment rates, poverty levels, and the availability of social services.
Interestingly, SNAP participation rates can be seen as a reflection of broader socioeconomic trends. For instance, areas with higher poverty rates often show a greater reliance on SNAP benefits. According to the U.S. Department of Agriculture (USDA), as of the latest statistics, approximately 42 million Americans, or about 12.5% of the population, participated in SNAP. This number indicates a significant reliance on food assistance in many communities.
However, the map also illustrates that participation isn't uniform across the country. Urban areas often have higher participation rates compared to rural districts, where food insecurity issues may not be as readily visible. In urban centers, the cost of living can be a contributing factor, as families struggle to meet basic needs amid rising housing and food costs. Conversely, in rural areas, while the poverty rate may be lower, access to resources and services can be limited, which might affect enrollment in SNAP.
Another critical aspect to consider is the stigma associated with receiving food assistance. In some communities, individuals may hesitate to apply for SNAP benefits due to fears of judgment or misunderstanding. This stigma can lead to underreporting of households that truly qualify for assistance. Moreover, immigrant families may also face additional barriers, including language and cultural differences, which can affect their participation rates.
Regional Analysis
When we analyze SNAP participation by region, distinct patterns emerge. For example, the Southern states often have some of the highest rates of SNAP enrollment. States like Mississippi, Louisiana, and Arkansas consistently report high percentages of households participating in the program. This trend correlates with higher poverty levels and less access to employment opportunities in these areas.
In contrast, regions such as the Northeast generally show lower participation rates. States like New Hampshire and Vermont often have more robust economic conditions and social support systems, resulting in fewer households relying on SNAP. Interestingly, even within states, significant disparities can exist. For instance, in California, urban districts like Los Angeles have high participation rates, while wealthier areas such as Silicon Valley report much lower numbers.
The Midwest presents a mixed picture, with states like Indiana and Ohio showing considerable SNAP participation, while others, such as North Dakota, display lower rates. This variation often reflects the agricultural economy's influence in rural areas, where food production may mitigate food insecurity.
Significance and Impact
Understanding the landscape of SNAP participation is crucial for policymakers, social workers, and community organizations. This map not only highlights where food insecurity is most prevalent but also informs the allocation of resources and services to combat hunger. As we look to the future, trends indicate that economic fluctuations, such as those caused by the COVID-19 pandemic, will continue to impact SNAP enrollment. Many families that were previously self-sufficient may find themselves turning to assistance programs for the first time.
Moreover, issues of food access and nutrition are increasingly recognized as fundamental public health concerns. As communities work to address these challenges, the data provided by this map can guide efforts to implement effective strategies tailored to the specific needs of each district. It's a powerful reminder that while SNAP is a federal program, its impact is deeply local, influencing the lives of millions across the country.
The ongoing conversation about food security and assistance will remain vital as we strive for a society where no one goes hungry. What’s particularly interesting is how maps like this one can reveal not just the statistics, but the human stories behind those numbers. They encourage us to think critically about the resources available in our communities and the policies that shape our access to food and nutrition.
Visualization Details
- Published
- October 28, 2025
- Views
- 16
Comments
Loading comments...