Map of Regions Accounting for 50% of Global GDP

Marcus Rodriguez
Historical Geography Expert
Marcus Rodriguez specializes in historical cartography and geographic data analysis. With a background in both history and geography, he brings unique...
Geographic Analysis
What This Map Shows
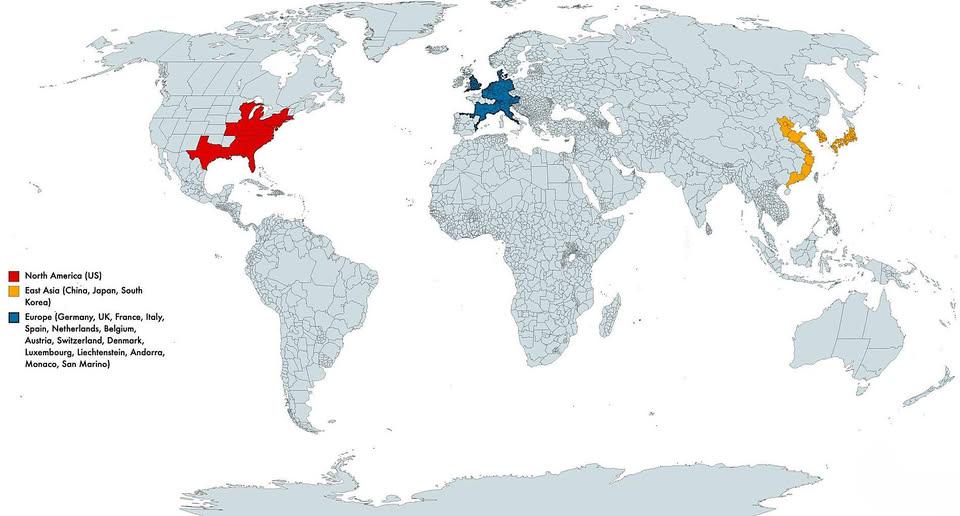
This map highlights three pivotal regions across three continents that collectively account for a staggering 50% of the world's Gross Domestic Product (GDP). These regions are not only economic powerhouses but also crucial players in global commerce and innovation. Understanding their economic significance provides insight into the dynamics of the global economy and how wealth is distributed across the planet.
Deep Dive into Global GDP
Gross Domestic Product (GDP) is a key indicator of a country's economic performance. It measures the total value of all goods and services produced within a country's borders over a specific time period. The regions identified in the map—North America, Western Europe, and East Asia—are integral to understanding global economic trends.
Interestingly, the GDP of these regions is not just about the numbers; it's about the intricate web of trade, investment, and innovation that drives their economies. North America, primarily led by the United States, is characterized by its diverse economy, advanced technology sector, and extensive natural resources. The U.S. economy alone is the largest in the world, contributing over $21 trillion to the global GDP.
Western Europe, encompassing countries like Germany, France, and the United Kingdom, has a GDP that thrives on manufacturing, financial services, and a robust welfare system. Germany, for instance, is known for its engineering prowess and is often regarded as the economic engine of Europe.
On the other hand, East Asia, with China as its dominant player, has witnessed rapid economic growth over the past few decades. China's GDP has skyrocketed from less than $300 billion in the early 1990s to over $17 trillion today, making it the second-largest economy globally. Japan and South Korea also contribute significantly, with their advanced technology and manufacturing sectors.
What's fascinating is how interconnected these regions are. Trade agreements, multinational corporations, and supply chains span continents, highlighting the globalized nature of our economy. For example, goods manufactured in East Asia often find their way to North America and Europe, showcasing the synergy between these economic giants.
Regional Analysis
Let’s break down these regions a bit further. In North America, the U.S. economy is complemented by its neighbors, Canada and Mexico, through initiatives like the United States-Mexico-Canada Agreement (USMCA). This trade bloc promotes economic cooperation and significantly impacts GDP contributions from this region.
In Western Europe, the European Union plays a crucial role in facilitating trade and economic stability among its member states. The Eurozone, which utilizes the euro as its currency, enables smoother transactions and economic integration, fostering an environment where GDP growth can flourish.
In East Asia, China's rise has been meteoric. The Belt and Road Initiative, aimed at enhancing global trade routes, is a prime example of how China is investing in infrastructure not only domestically but also in neighboring countries, further expanding its economic influence. Japan and South Korea, while smaller in terms of landmass, are technological giants, with innovations in robotics and electronics driving their economies forward.
However, these regions are not without their challenges. North America faces economic inequality and debates over trade policies. Western Europe grapples with economic disparities between its northern and southern countries, exacerbated by Brexit and the refugee crisis. East Asia, particularly China, is navigating the complexities of an aging population and environmental concerns as it pushes for further growth.
Significance and Impact
Understanding the economic contributions of these regions is vital for policymakers, businesses, and investors alike. The concentration of wealth, as illustrated in this map, indicates not only where economic power resides but also where potential growth markets may emerge. As global dynamics shift, emerging economies, particularly in Africa and South Asia, are beginning to play more significant roles in shaping the future of global GDP.
As we look ahead, trends such as digital transformation, sustainable development, and changing consumer behaviors are likely to impact these regions' economic trajectories. Ever wondered why some regions thrive while others struggle? The answer lies in a myriad of factors, including governance, resources, and innovation.
In conclusion, the map showcasing the regions accounting for 50% of global GDP serves as a reminder of the interconnectedness of our world. It highlights the need for collaboration and adaptability as we navigate the complexities of a rapidly changing global economy.
Visualization Details
- Published
- October 27, 2025
- Views
- 12
Comments
Loading comments...