Pizza Consumption Per Person Per Year Map

Alex Cartwright
Senior Cartographer & GIS Specialist
Alex Cartwright is a renowned cartographer and geographic information systems specialist with over 15 years of experience in spatial analysis and data...
Geographic Analysis
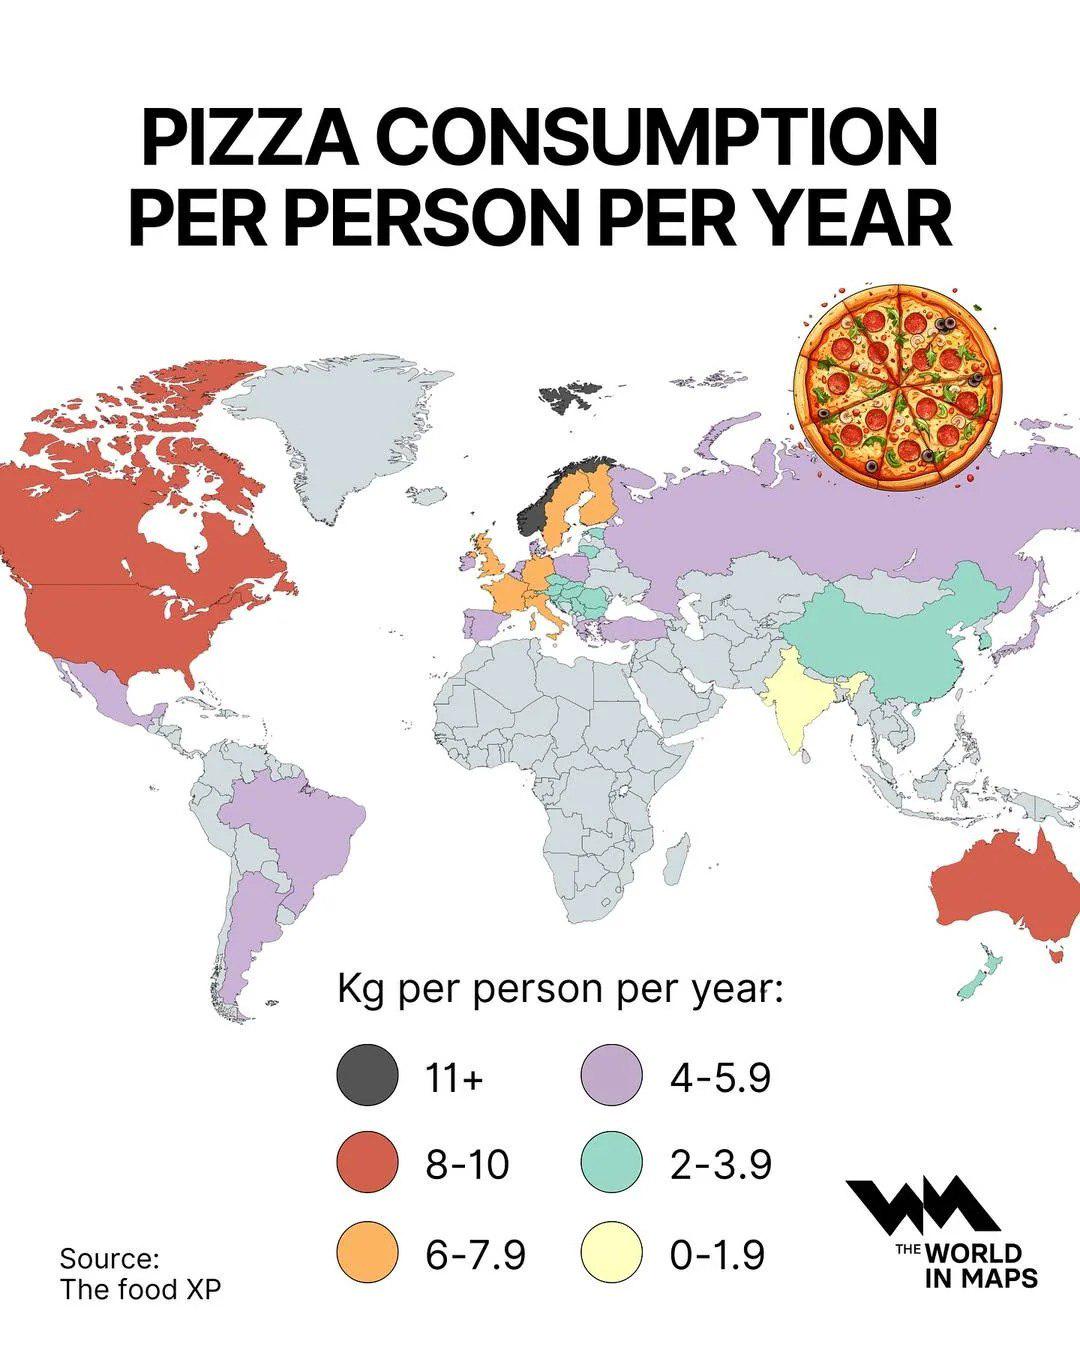
What This Map Shows
The "Pizza Consumption Per Person Per Year Map" provides a fascinating visual representation of how much pizza individuals consume on average across various countries. By portraying this data, the map not only highlights a beloved global dish but also serves as a lens to explore cultural preferences, dietary habits, and even economic factors surrounding food choices. With pizza being one of the most popular foods worldwide, understanding these consumption patterns can reveal much about social habits and culinary trends.
Deep Dive into Pizza Consumption
Pizza, a dish that originated in Italy, has taken the world by storm, evolving into numerous variations and styles across different cultures. Its journey from a Neapolitan street food to a staple in many households illustrates the globalization of cuisine. Interestingly, pizza consumption can be influenced by several factors including cultural significance, availability of ingredients, and economic status.
For instance, in the United States, pizza is often seen as a convenient meal option, leading to an impressive average consumption of approximately 23 pounds of pizza per person per year. This can be attributed to the fast-paced lifestyle where quick meals are in high demand. Major cities like New York and Chicago have made their own distinct contributions to pizza culture, with New York-style thin crust and Chicago's deep dish attracting millions of enthusiasts.
Conversely, in countries like Italy, where pizza was born, the average per capita consumption is lower, at around 8.5 pounds per year. This may seem surprising given Italy's historical connection to pizza, yet the Italian approach often emphasizes quality over quantity, with many Italians opting for more traditional, artisanal pizza experiences, savoring fewer slices but with greater appreciation.
In Asia, countries like Japan and South Korea have embraced pizza, incorporating local flavors into this classic dish. Pizza topped with seafood, teriyaki chicken, or even Kimchi is becoming increasingly popular, illustrating how cultural preferences shape food consumption. Interestingly, in Japan, the average pizza consumption is around 5 pounds per person per year, which may seem modest compared to Western nations, yet reflects a growing trend toward Western dining habits.
What's fascinating is that pizza consumption can also be a reflection of economic conditions. In emerging economies, as disposable incomes rise, so does the demand for fast food, including pizza. This has led to a spike in pizza consumption in countries like Brazil and India, where people are increasingly seeking affordable dining options that are both comforting and familiar.
Regional Analysis
When we analyze the map regionally, striking contrasts emerge. North America, particularly the United States and Canada, showcases the highest pizza consumption, with averages nearing 23 pounds per person annually. This region’s love for pizza can be linked to its strong fast-food culture and the prevalence of pizzerias in urban areas.
In Europe, while Italy holds a historical and cultural significance in pizza consumption, it is notable that countries like France and the UK are also seeing higher consumption rates, averaging around 12 to 15 pounds per person per year. Interestingly, pizza has evolved to fit local palates, with France often favoring gourmet toppings, setting a unique culinary trend.
Conversely, in continents like Africa, pizza consumption remains relatively low, with averages of around 2 to 3 pounds per person per year. However, this is changing, especially in urban areas where fast-food chains are expanding rapidly, leading to increased interest in pizza as a quick meal option. Countries like South Africa are showing signs of growing pizza popularity, reflecting significant urbanization trends.
Significance and Impact
Understanding pizza consumption patterns is more than just a culinary curiosity; it reflects broader social, cultural, and economic trends. The rise in pizza consumption in various regions signifies not only a shift in dietary preferences but also changing lifestyles and globalization effects. As people increasingly seek convenience and international flavors, pizza serves as a unifying food that transcends borders.
Moreover, the impact of pizza consumption on local economies can’t be overlooked. The pizza industry creates jobs, supports agriculture (through the demand for cheese, tomatoes, and flour), and promotes local businesses. As the map showcases varying consumption rates, it also hints at the potential for growth in emerging markets, where the appetite for pizza is steadily increasing.
As we look to the future, one can wonder how pizza consumption will evolve, especially with growing health consciousness and dietary changes. Will we see a rise in plant-based pizzas or gluten-free options? The ongoing shift in consumer preferences and dietary needs may significantly shape the pizza landscape in the coming years. Overall, this map does more than just showcase numbers; it invites us to reflect on our shared love for pizza and what it reveals about our societies.
Visualization Details
- Published
- October 27, 2025
- Views
- 6
Comments
Loading comments...