economic impact Maps
18 geographic visualizations tagged with "economic impact"
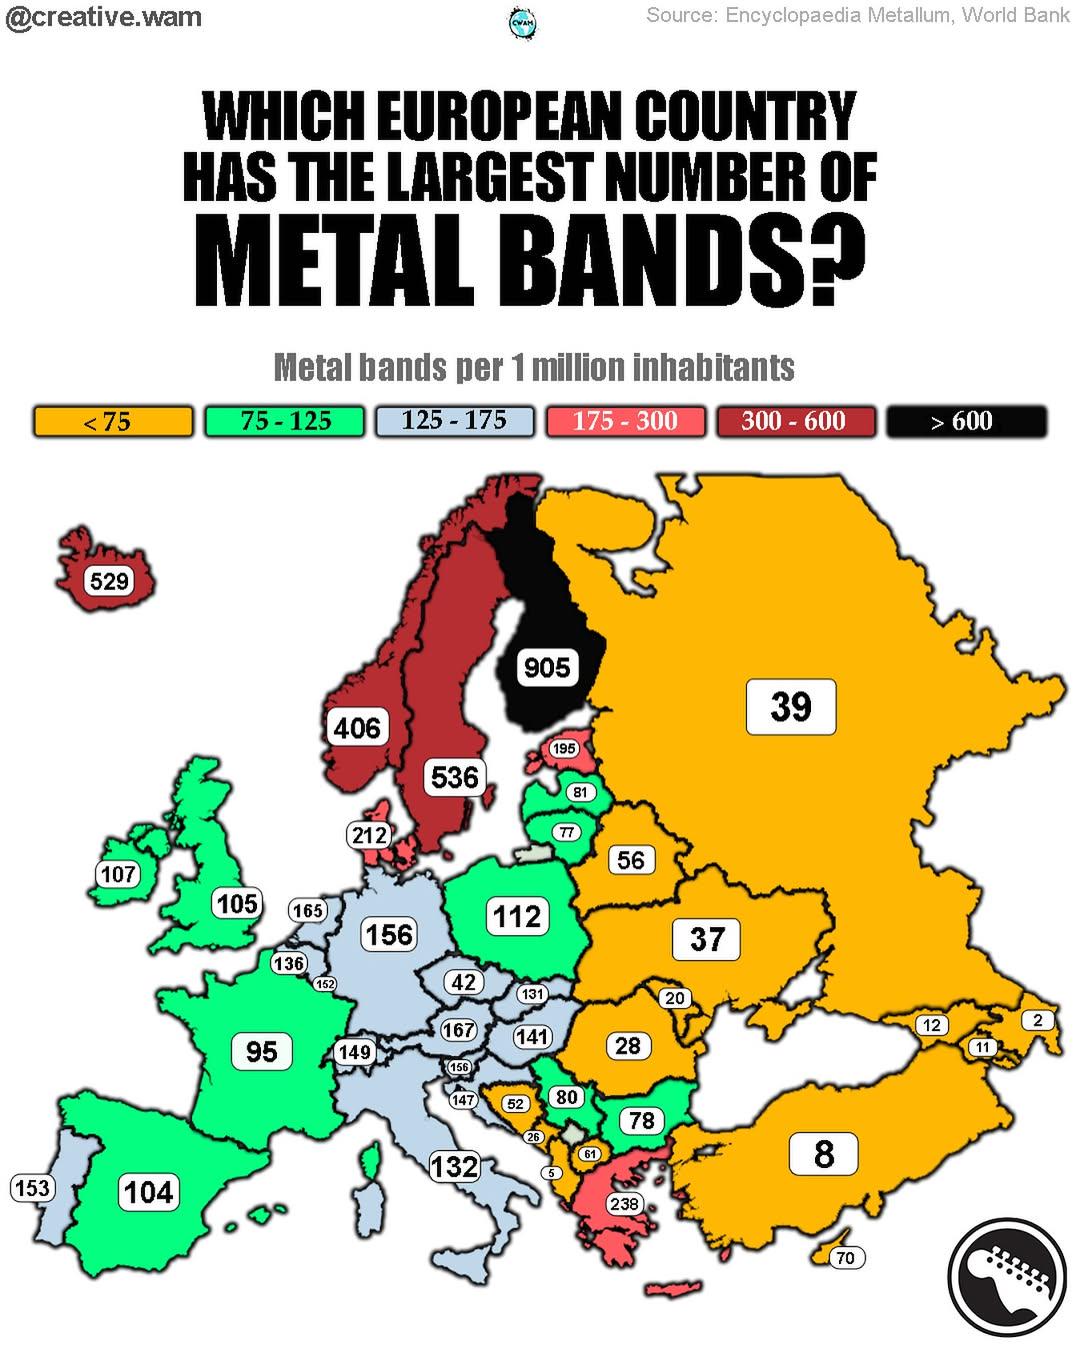
Map of Europe's Metal Production Centers
The visualization titled \...
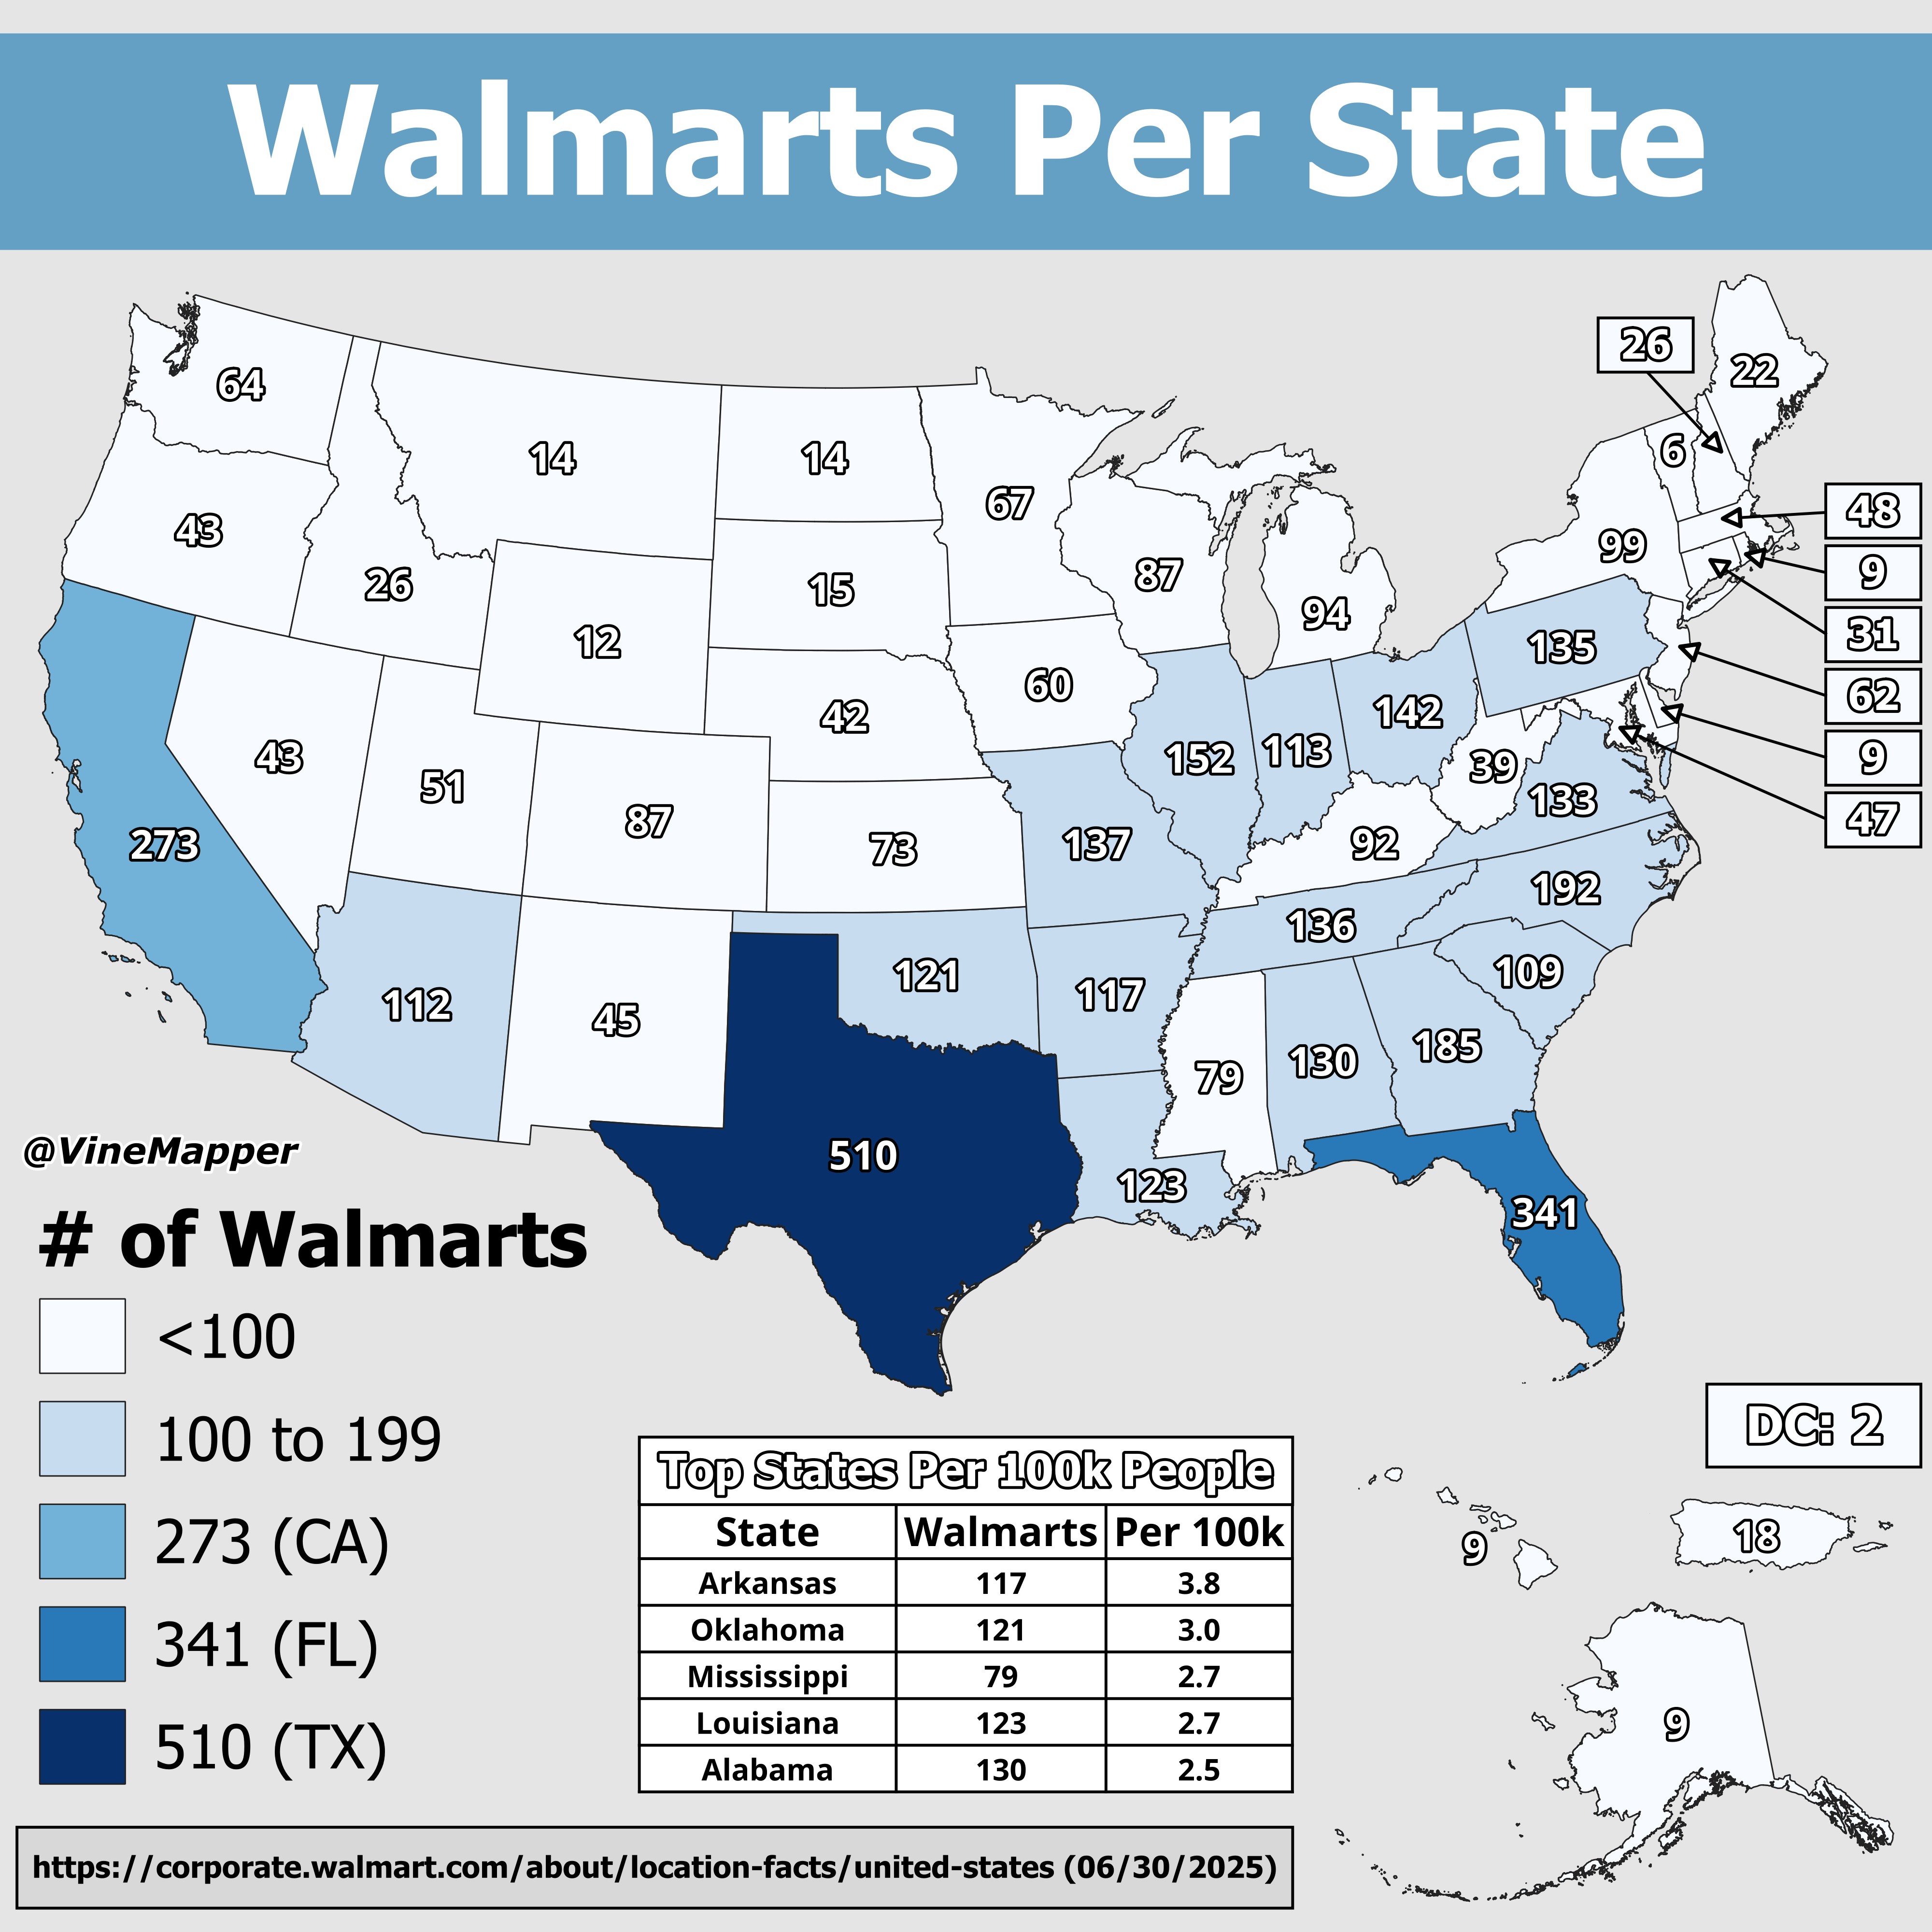
Walmarts Per 100k People Map
The "Walmarts Per 100k People Map" provides a striking visualization of the distribution of Walmart stores across variou...
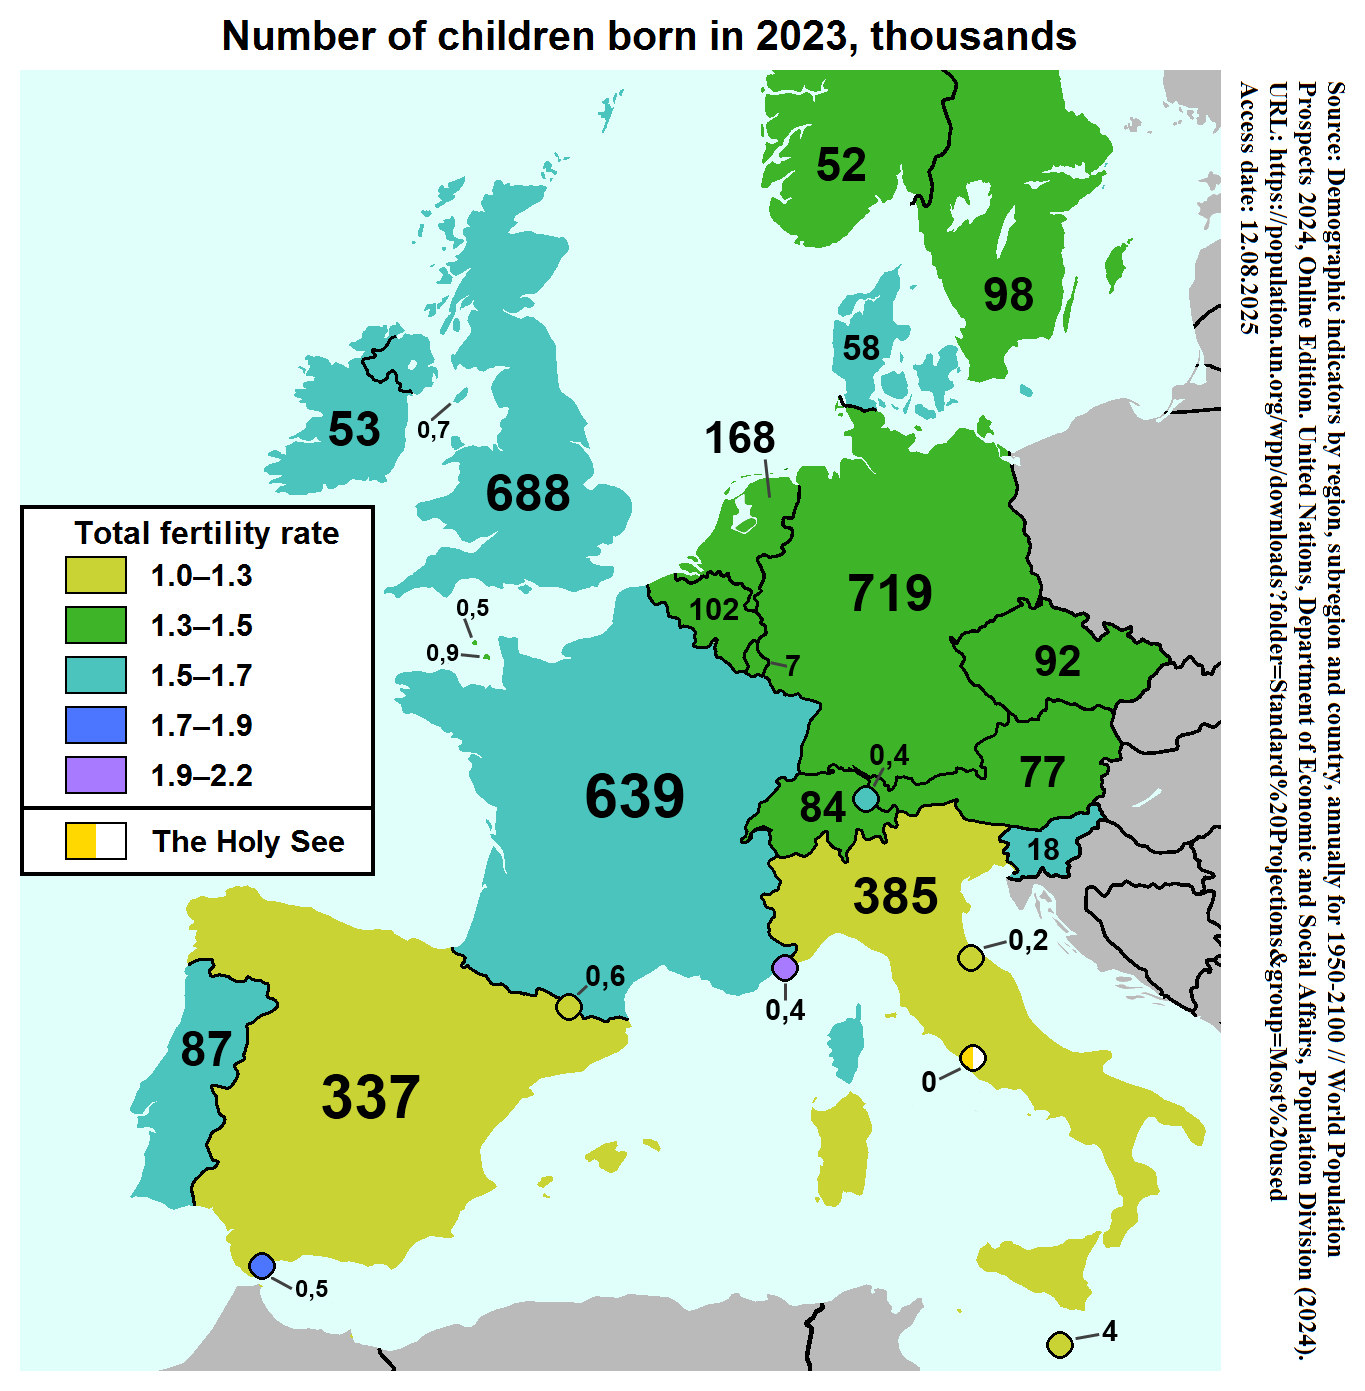
Total Fertility Rate and Children Born Map Western Europe 2023
The map titled "Total Fertility Rate and Number of Children Born in Western Europe, 2023" visually represents the fertil...
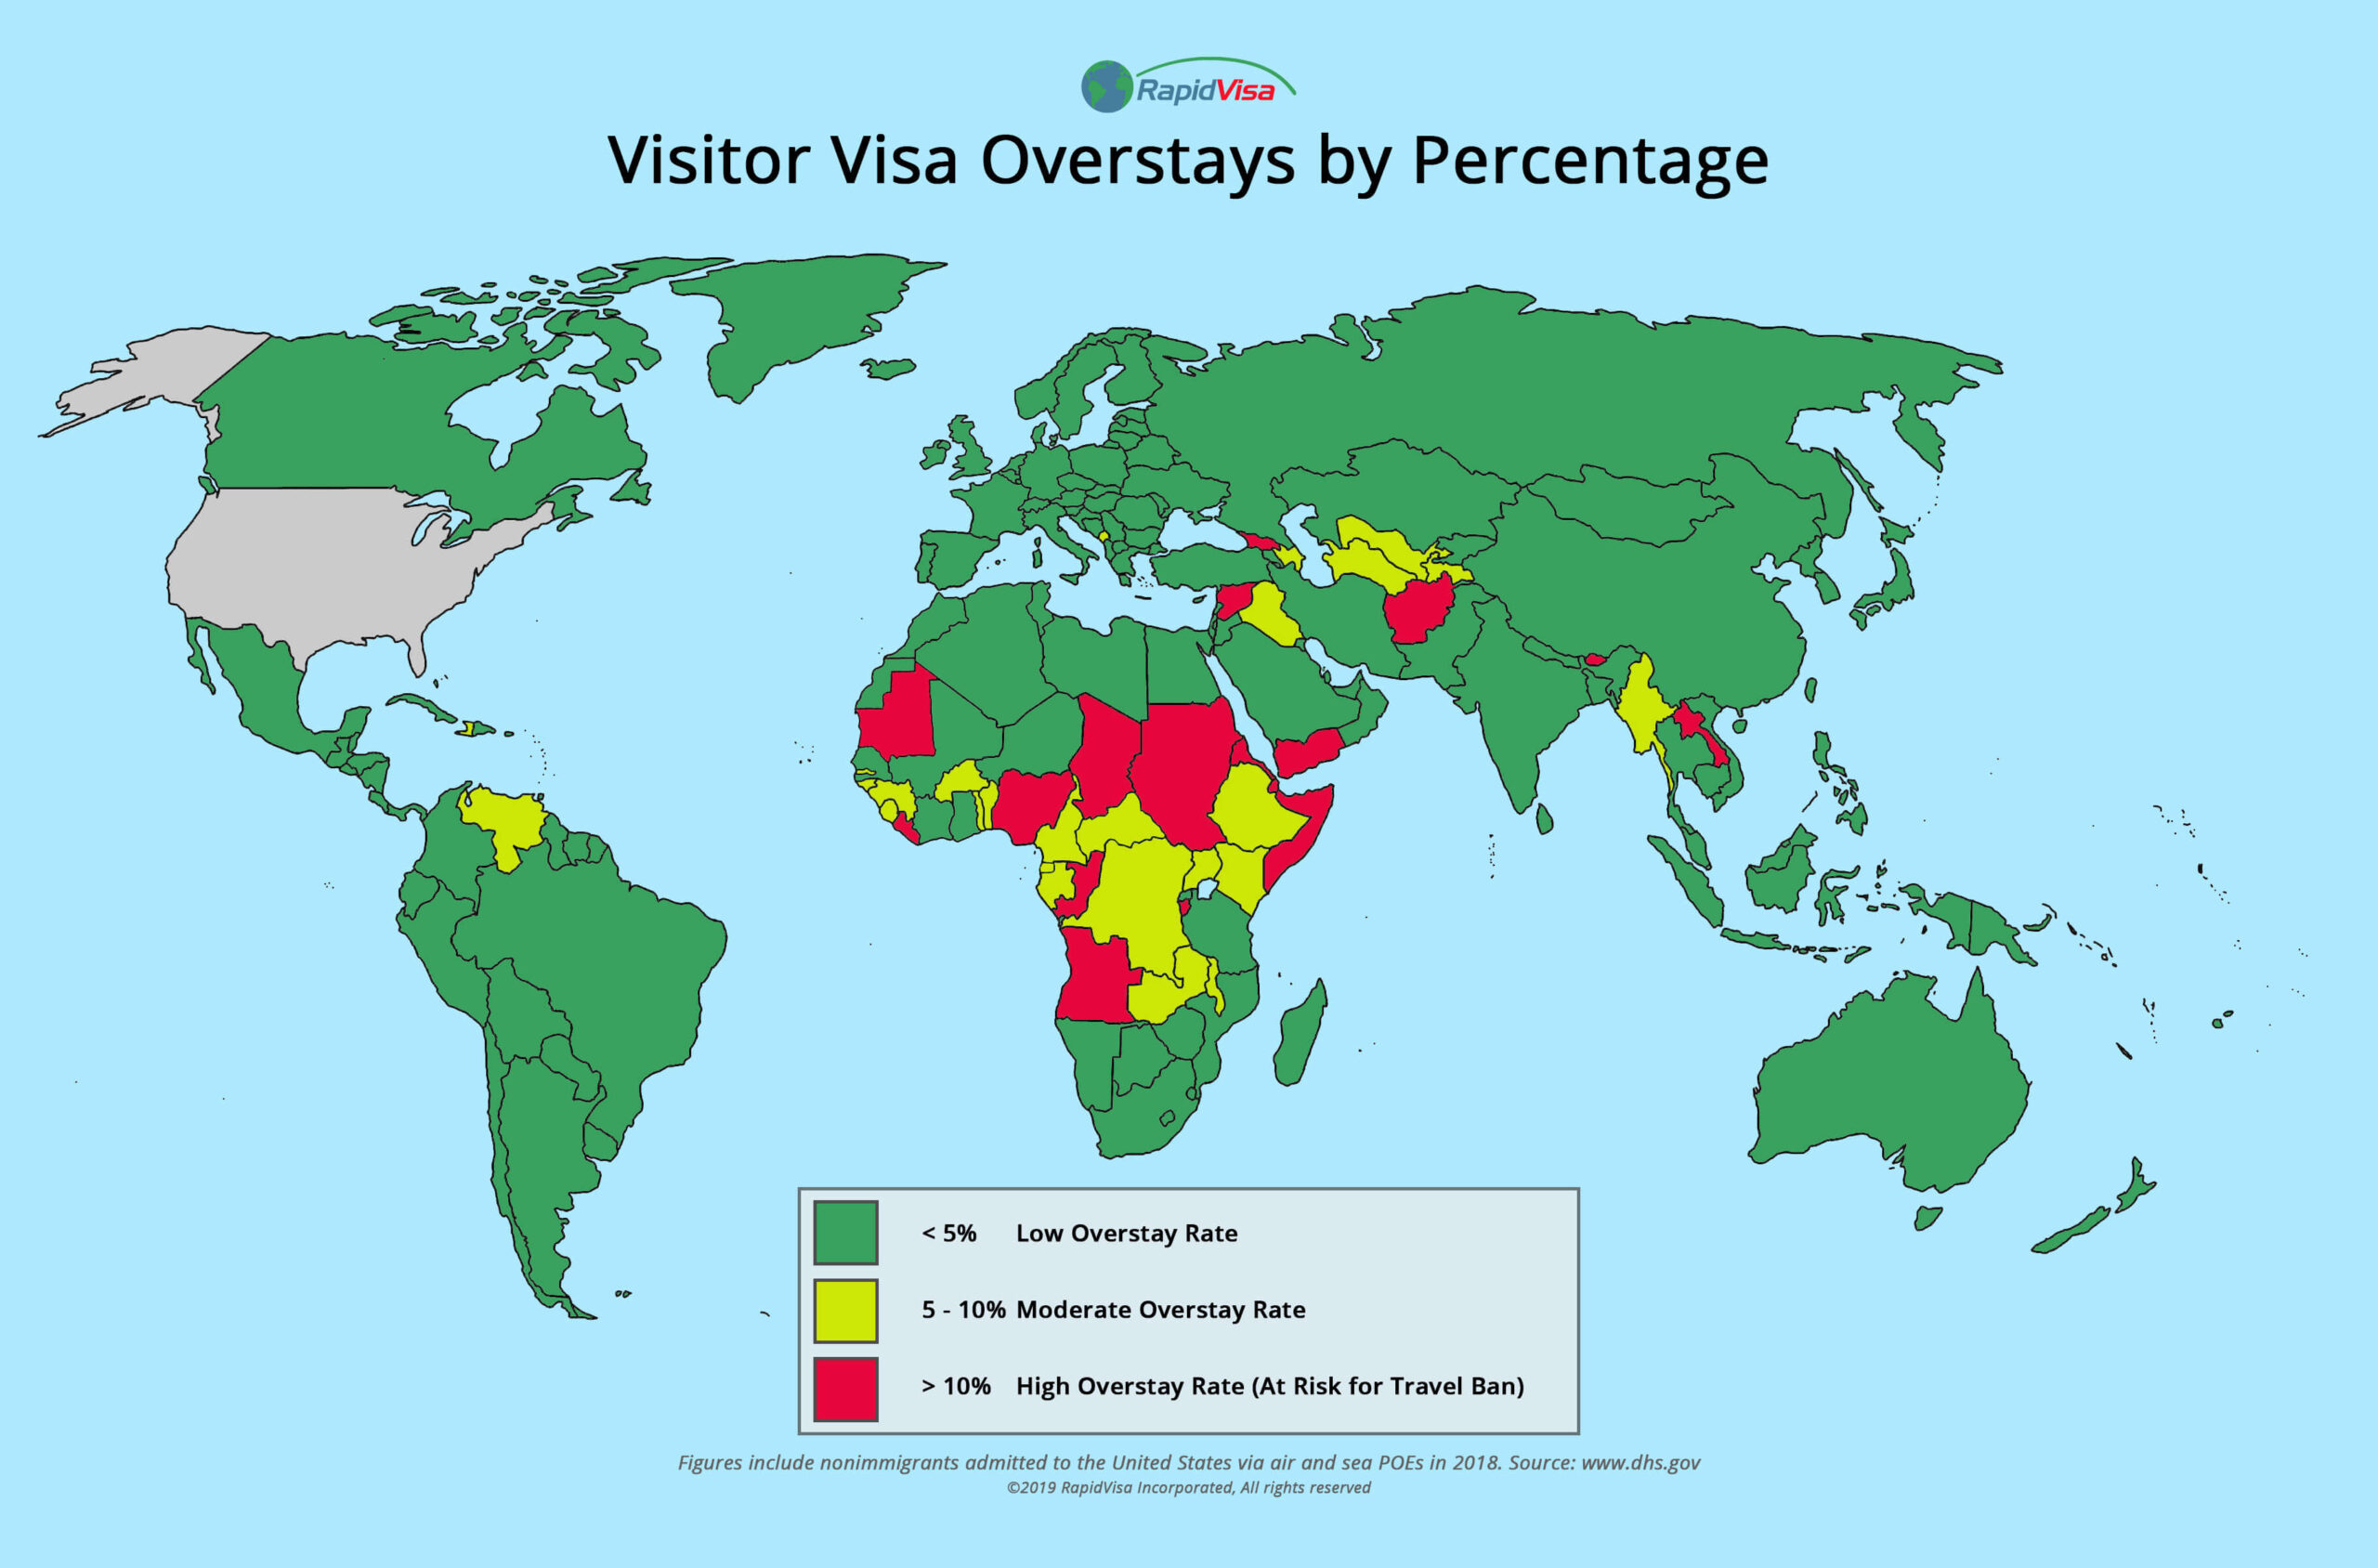
Visitor Visa Overstays in the United States by Percentage Map
The "Visitor Visa Overstays in the United States by Percentage" map provides a visual representation of the rates at whi...
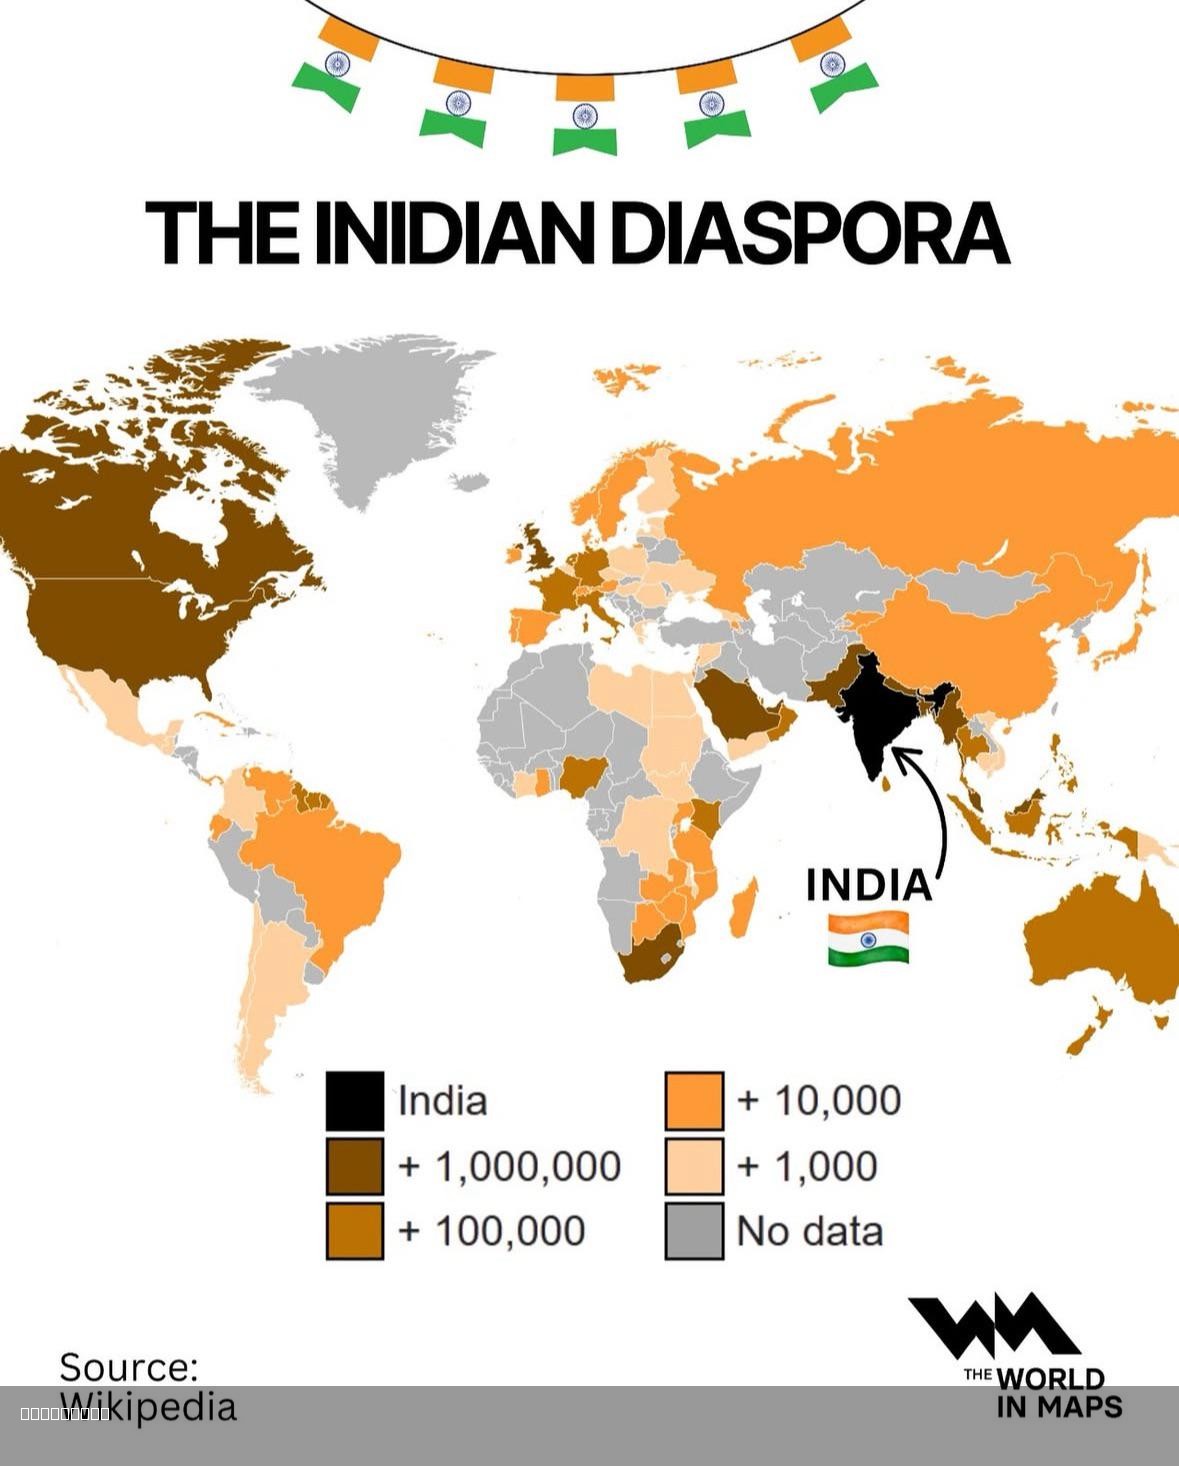
Indian Diaspora Population Distribution Map
The \...
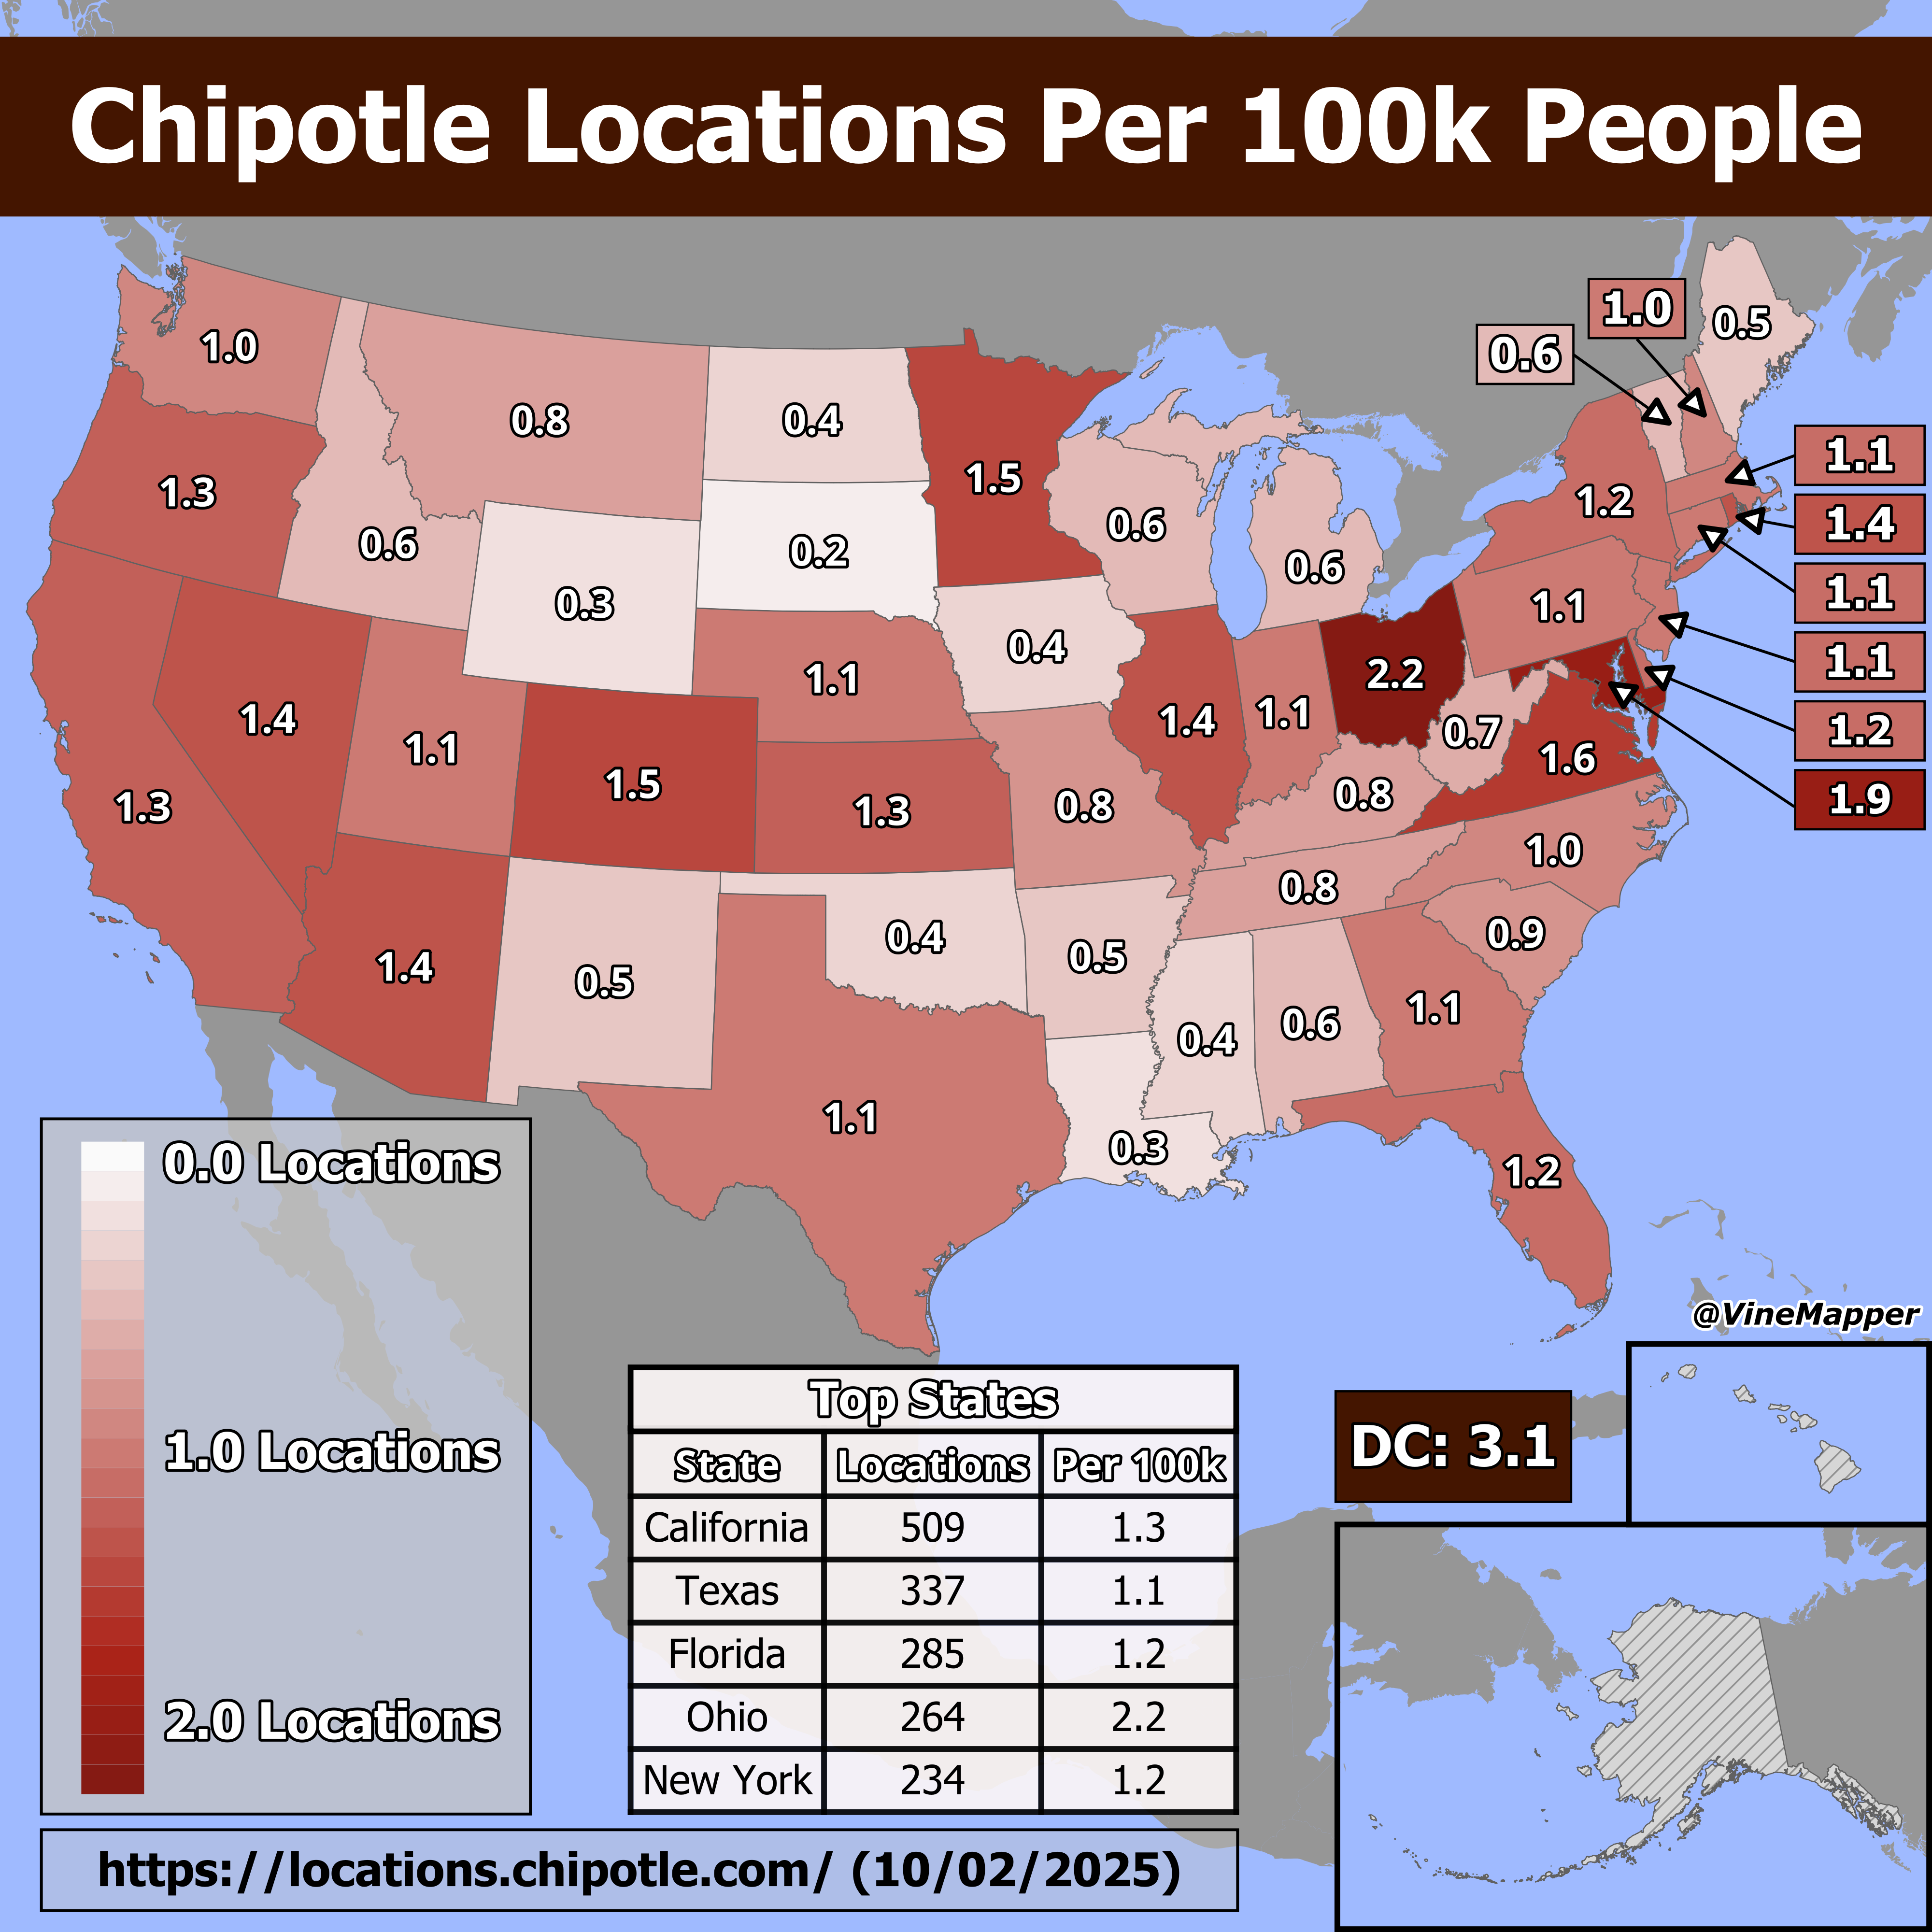
Chipotle Locations Per 100k People Map
The "Chipotle Locations Per 100k People" map provides a visual representation of how many Chipotle restaurants are avail...
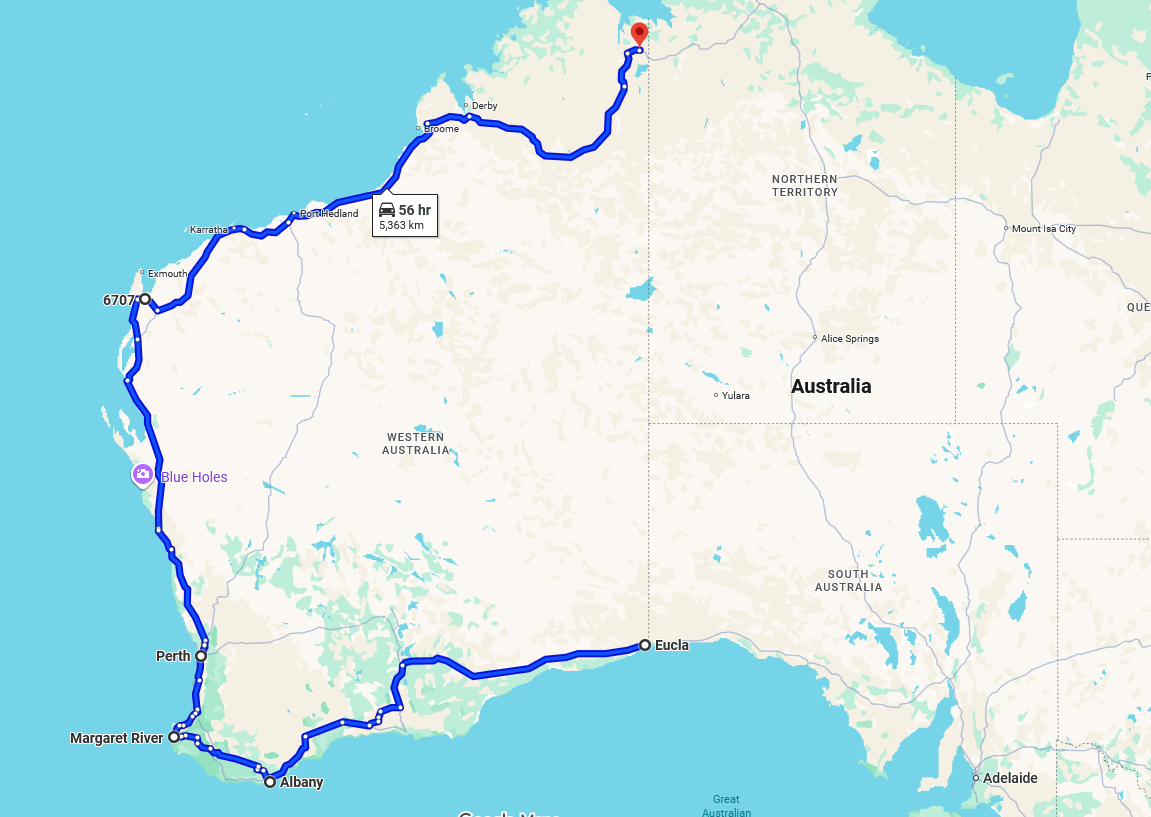
Longest One-Province Road Map
This map visualizes the longest one-province/state road in the world, stretching an impressive 5,363 kilometers and taki...
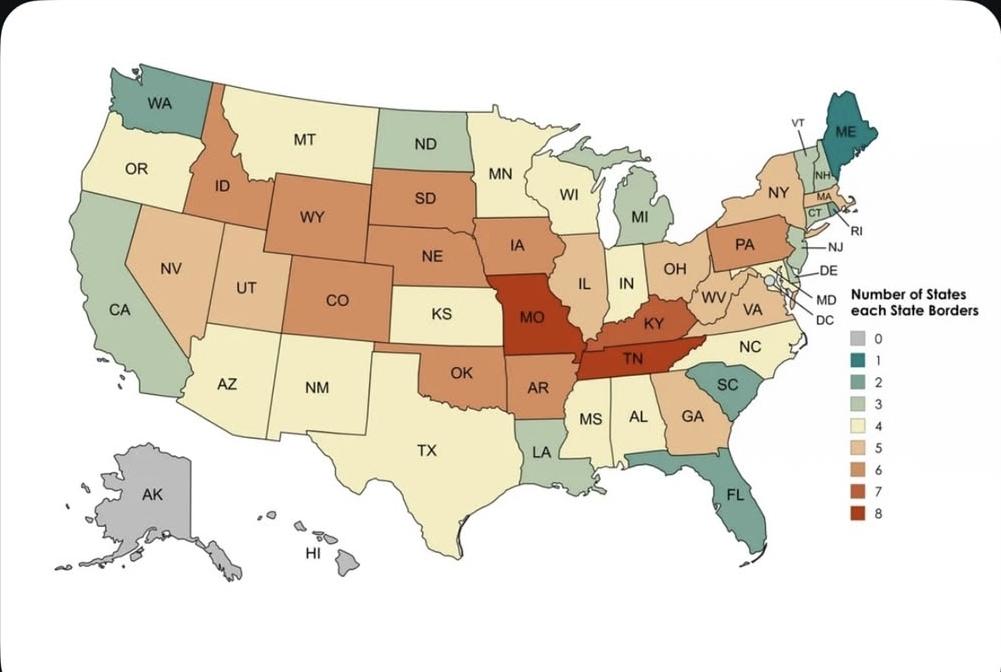
State Borders Map: How Many States Border Yours?
The \...
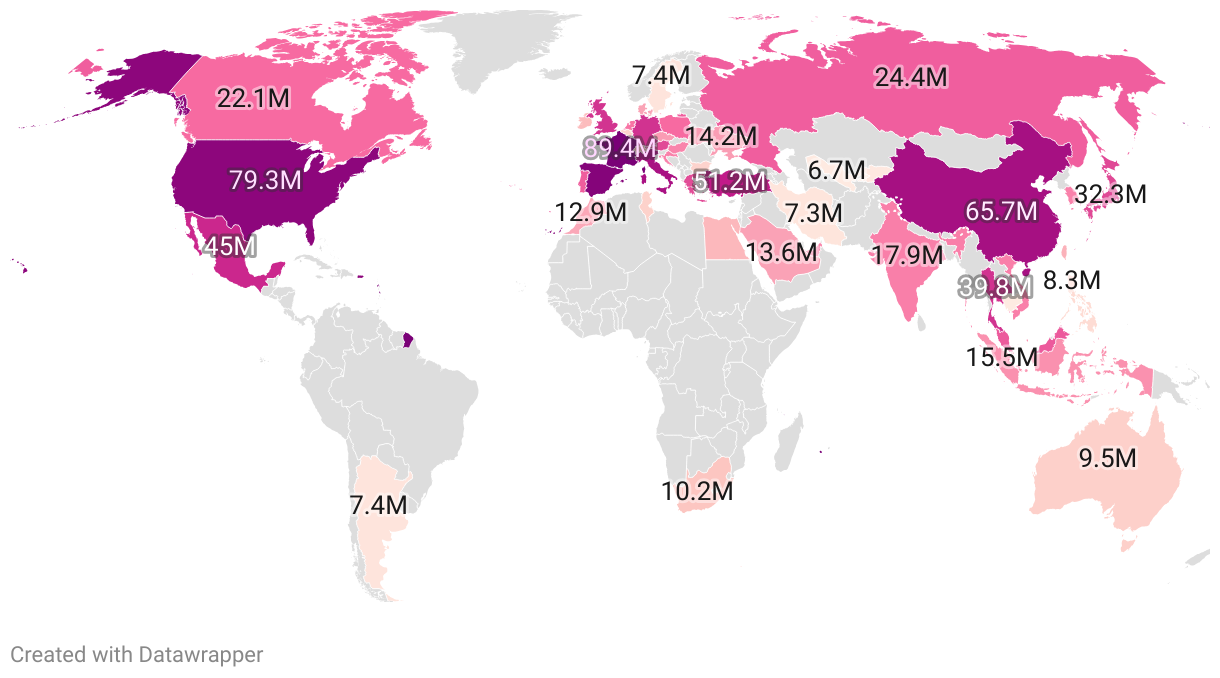
Tourism Numbers per Country Map 2025
The "Tourism Numbers per Country Map 2025" visualizes projected tourist arrivals across various countries, providing ins...
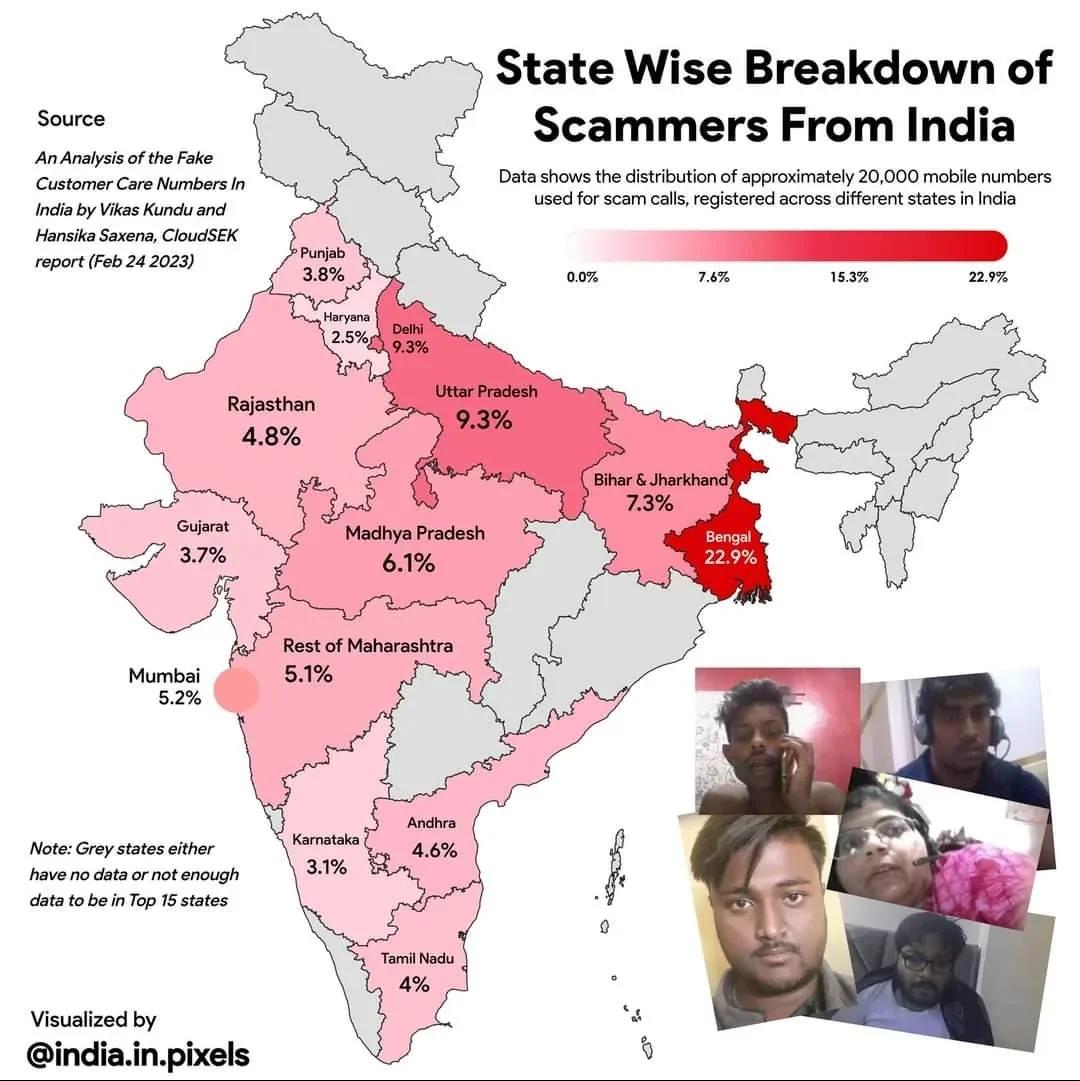
Scammers from India Statewise Map
The "Scammers from India Statewise Map" provides a visual representation of the prevalence of scam-related activities ac...
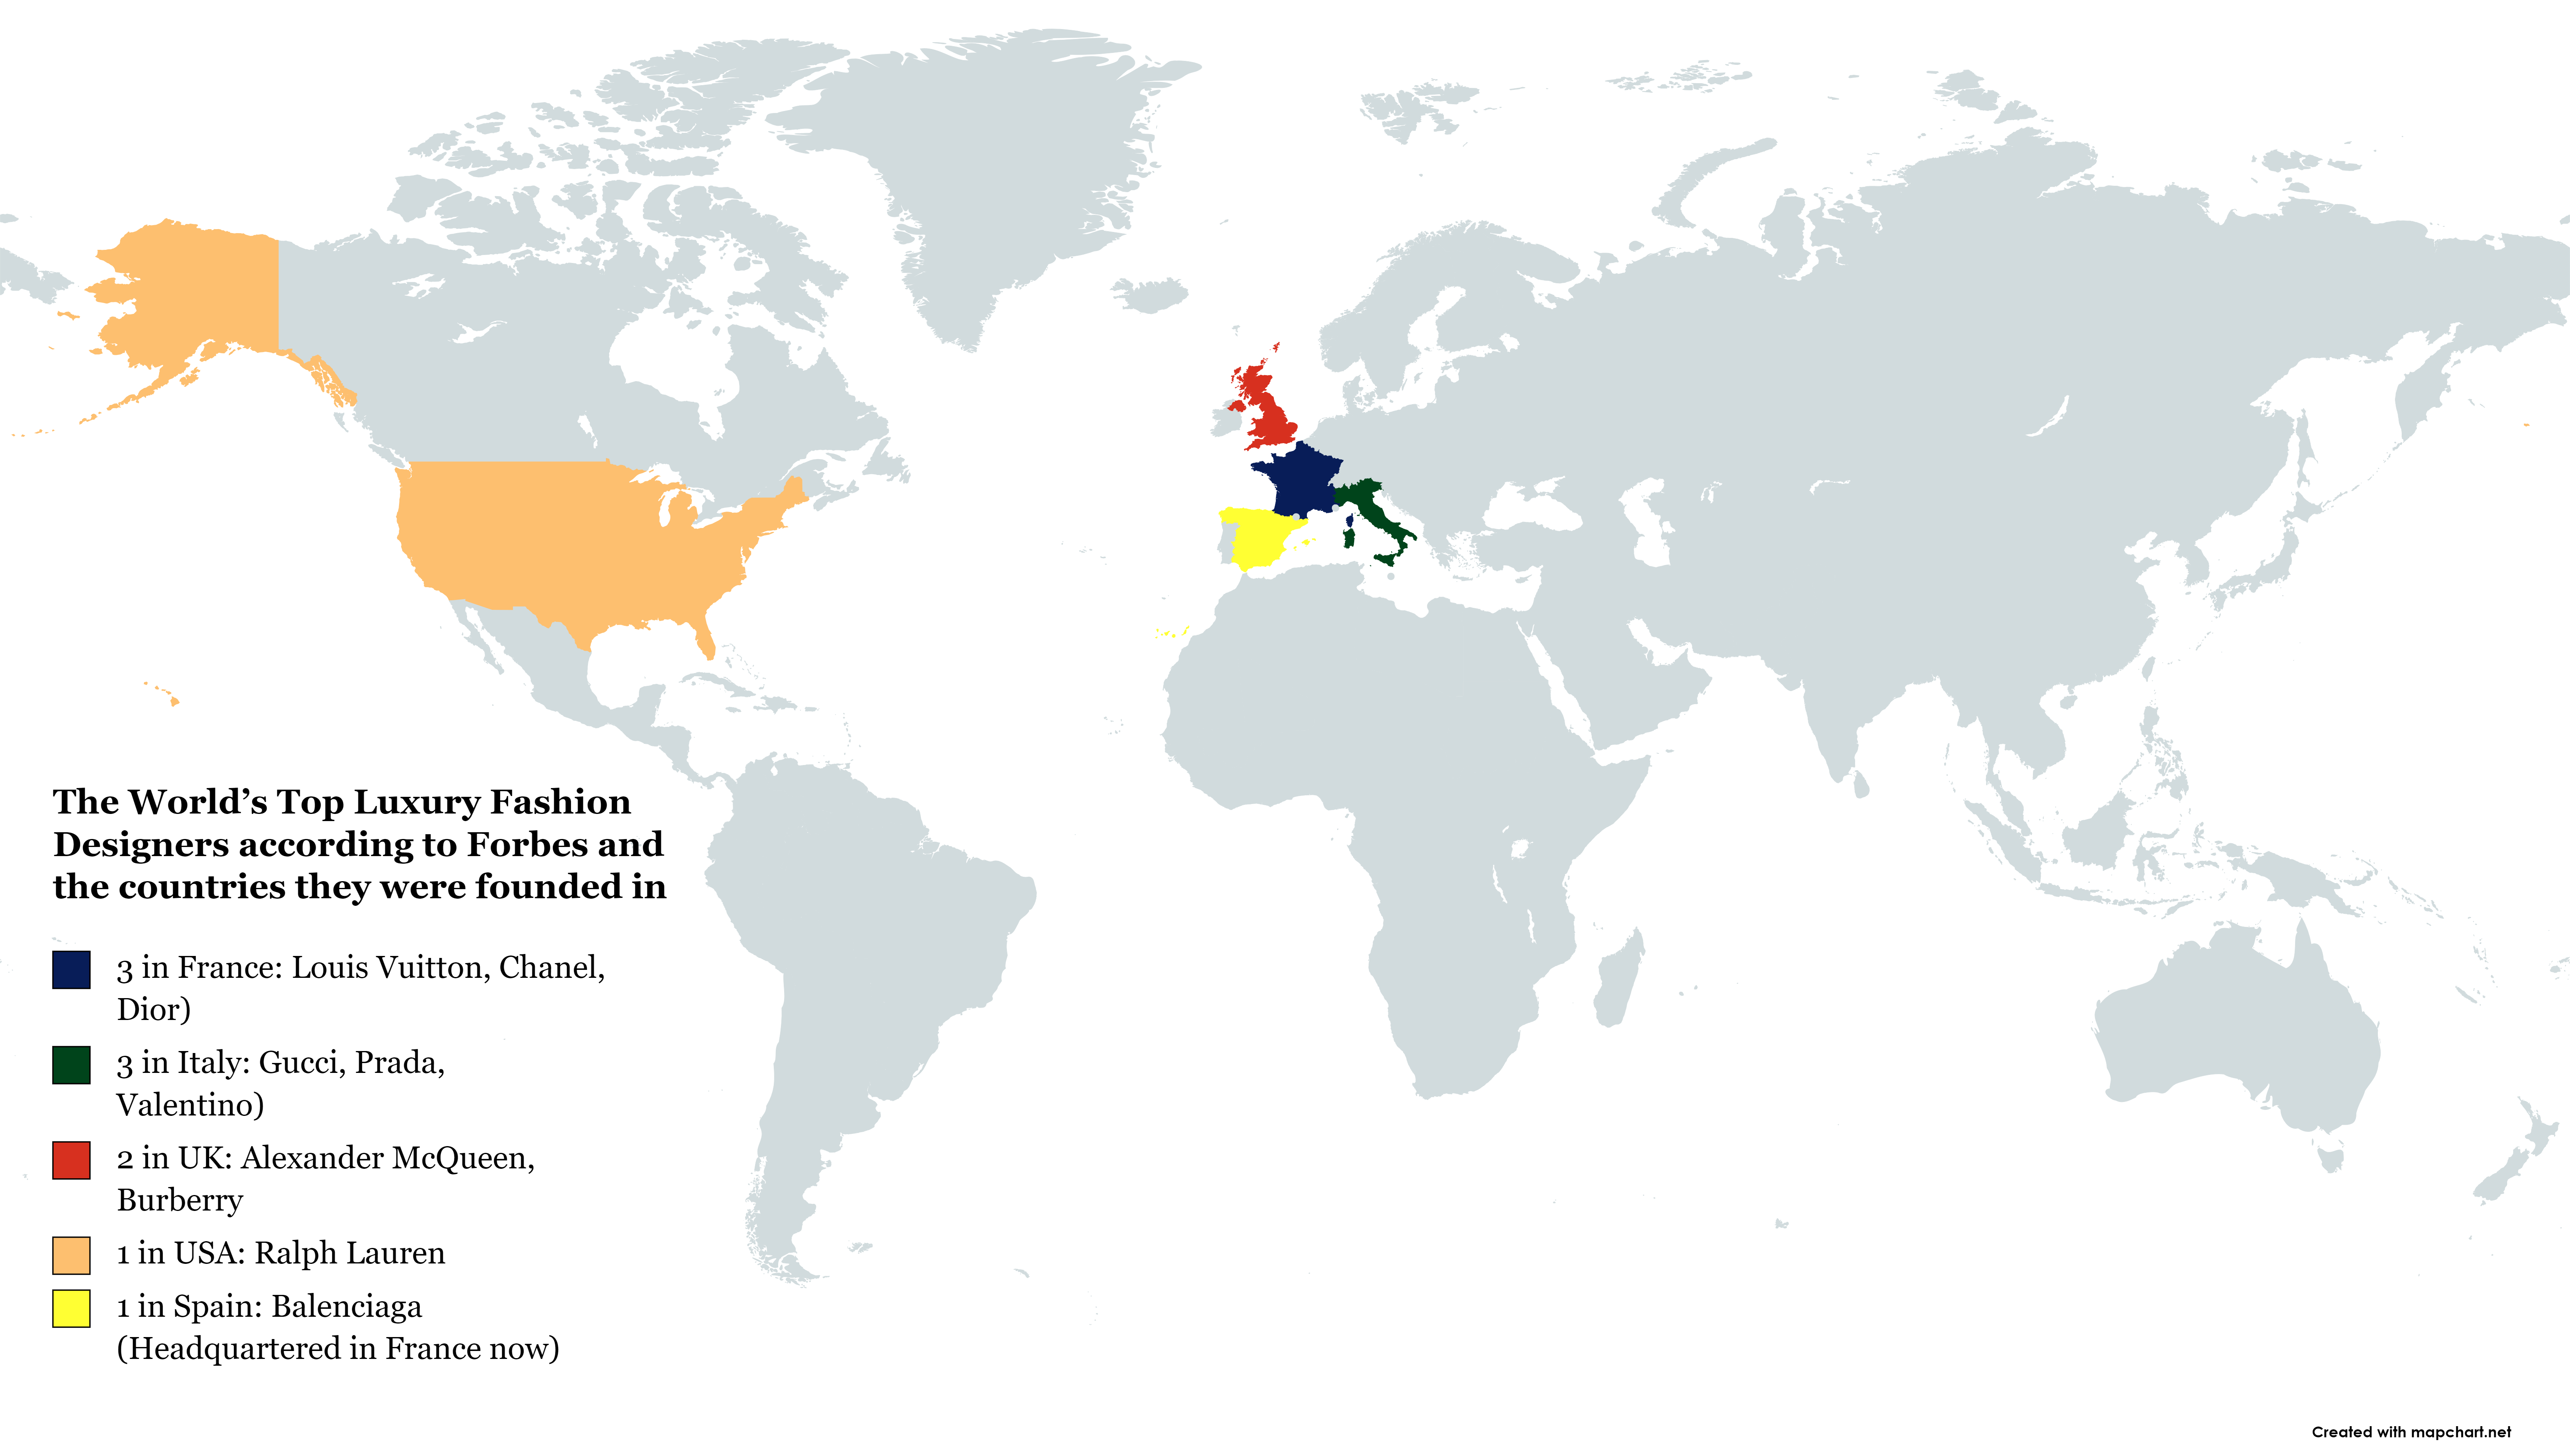
Map of Top Luxury Fashion Designers by Country
This map depicts the world's top luxury fashion designers as identified by Forbes, alongside the countries where these i...
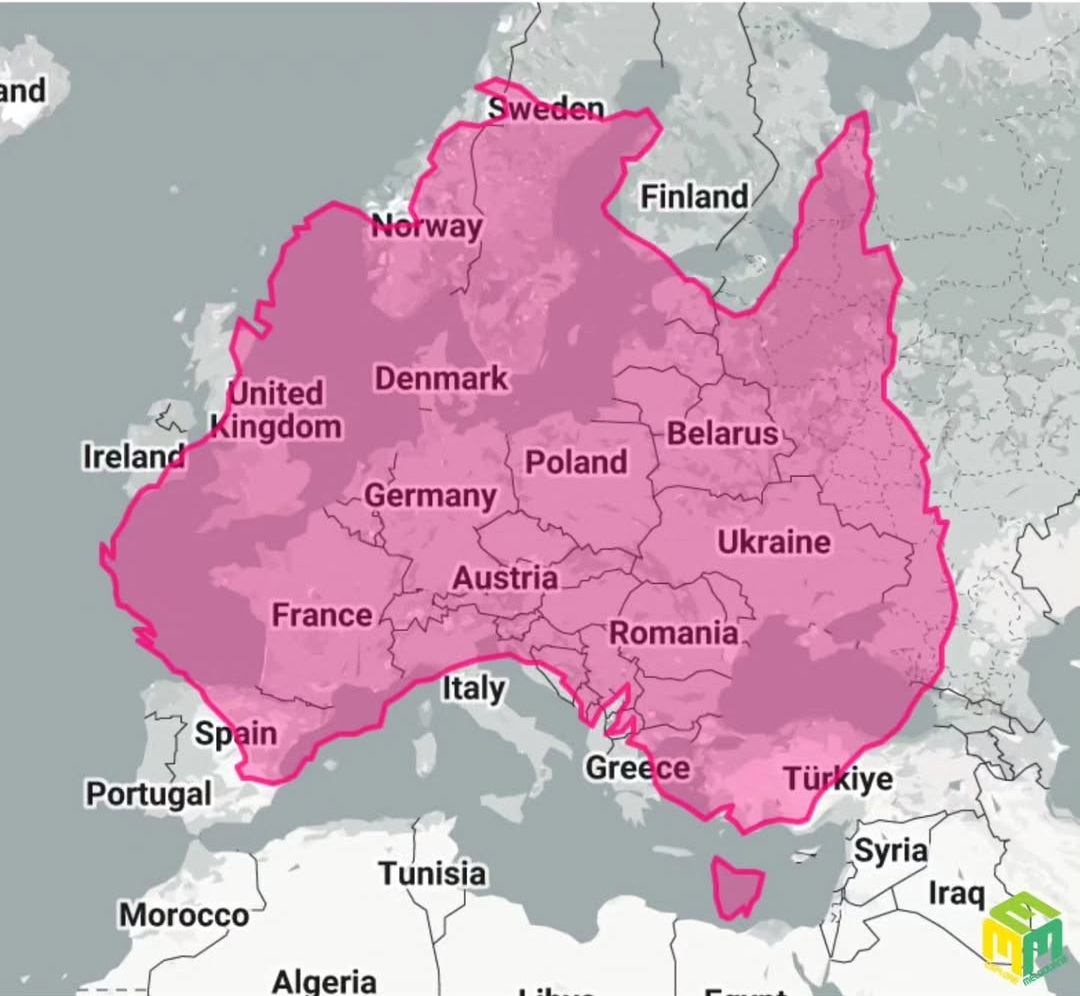
Tourism Trends Map of Australia
...
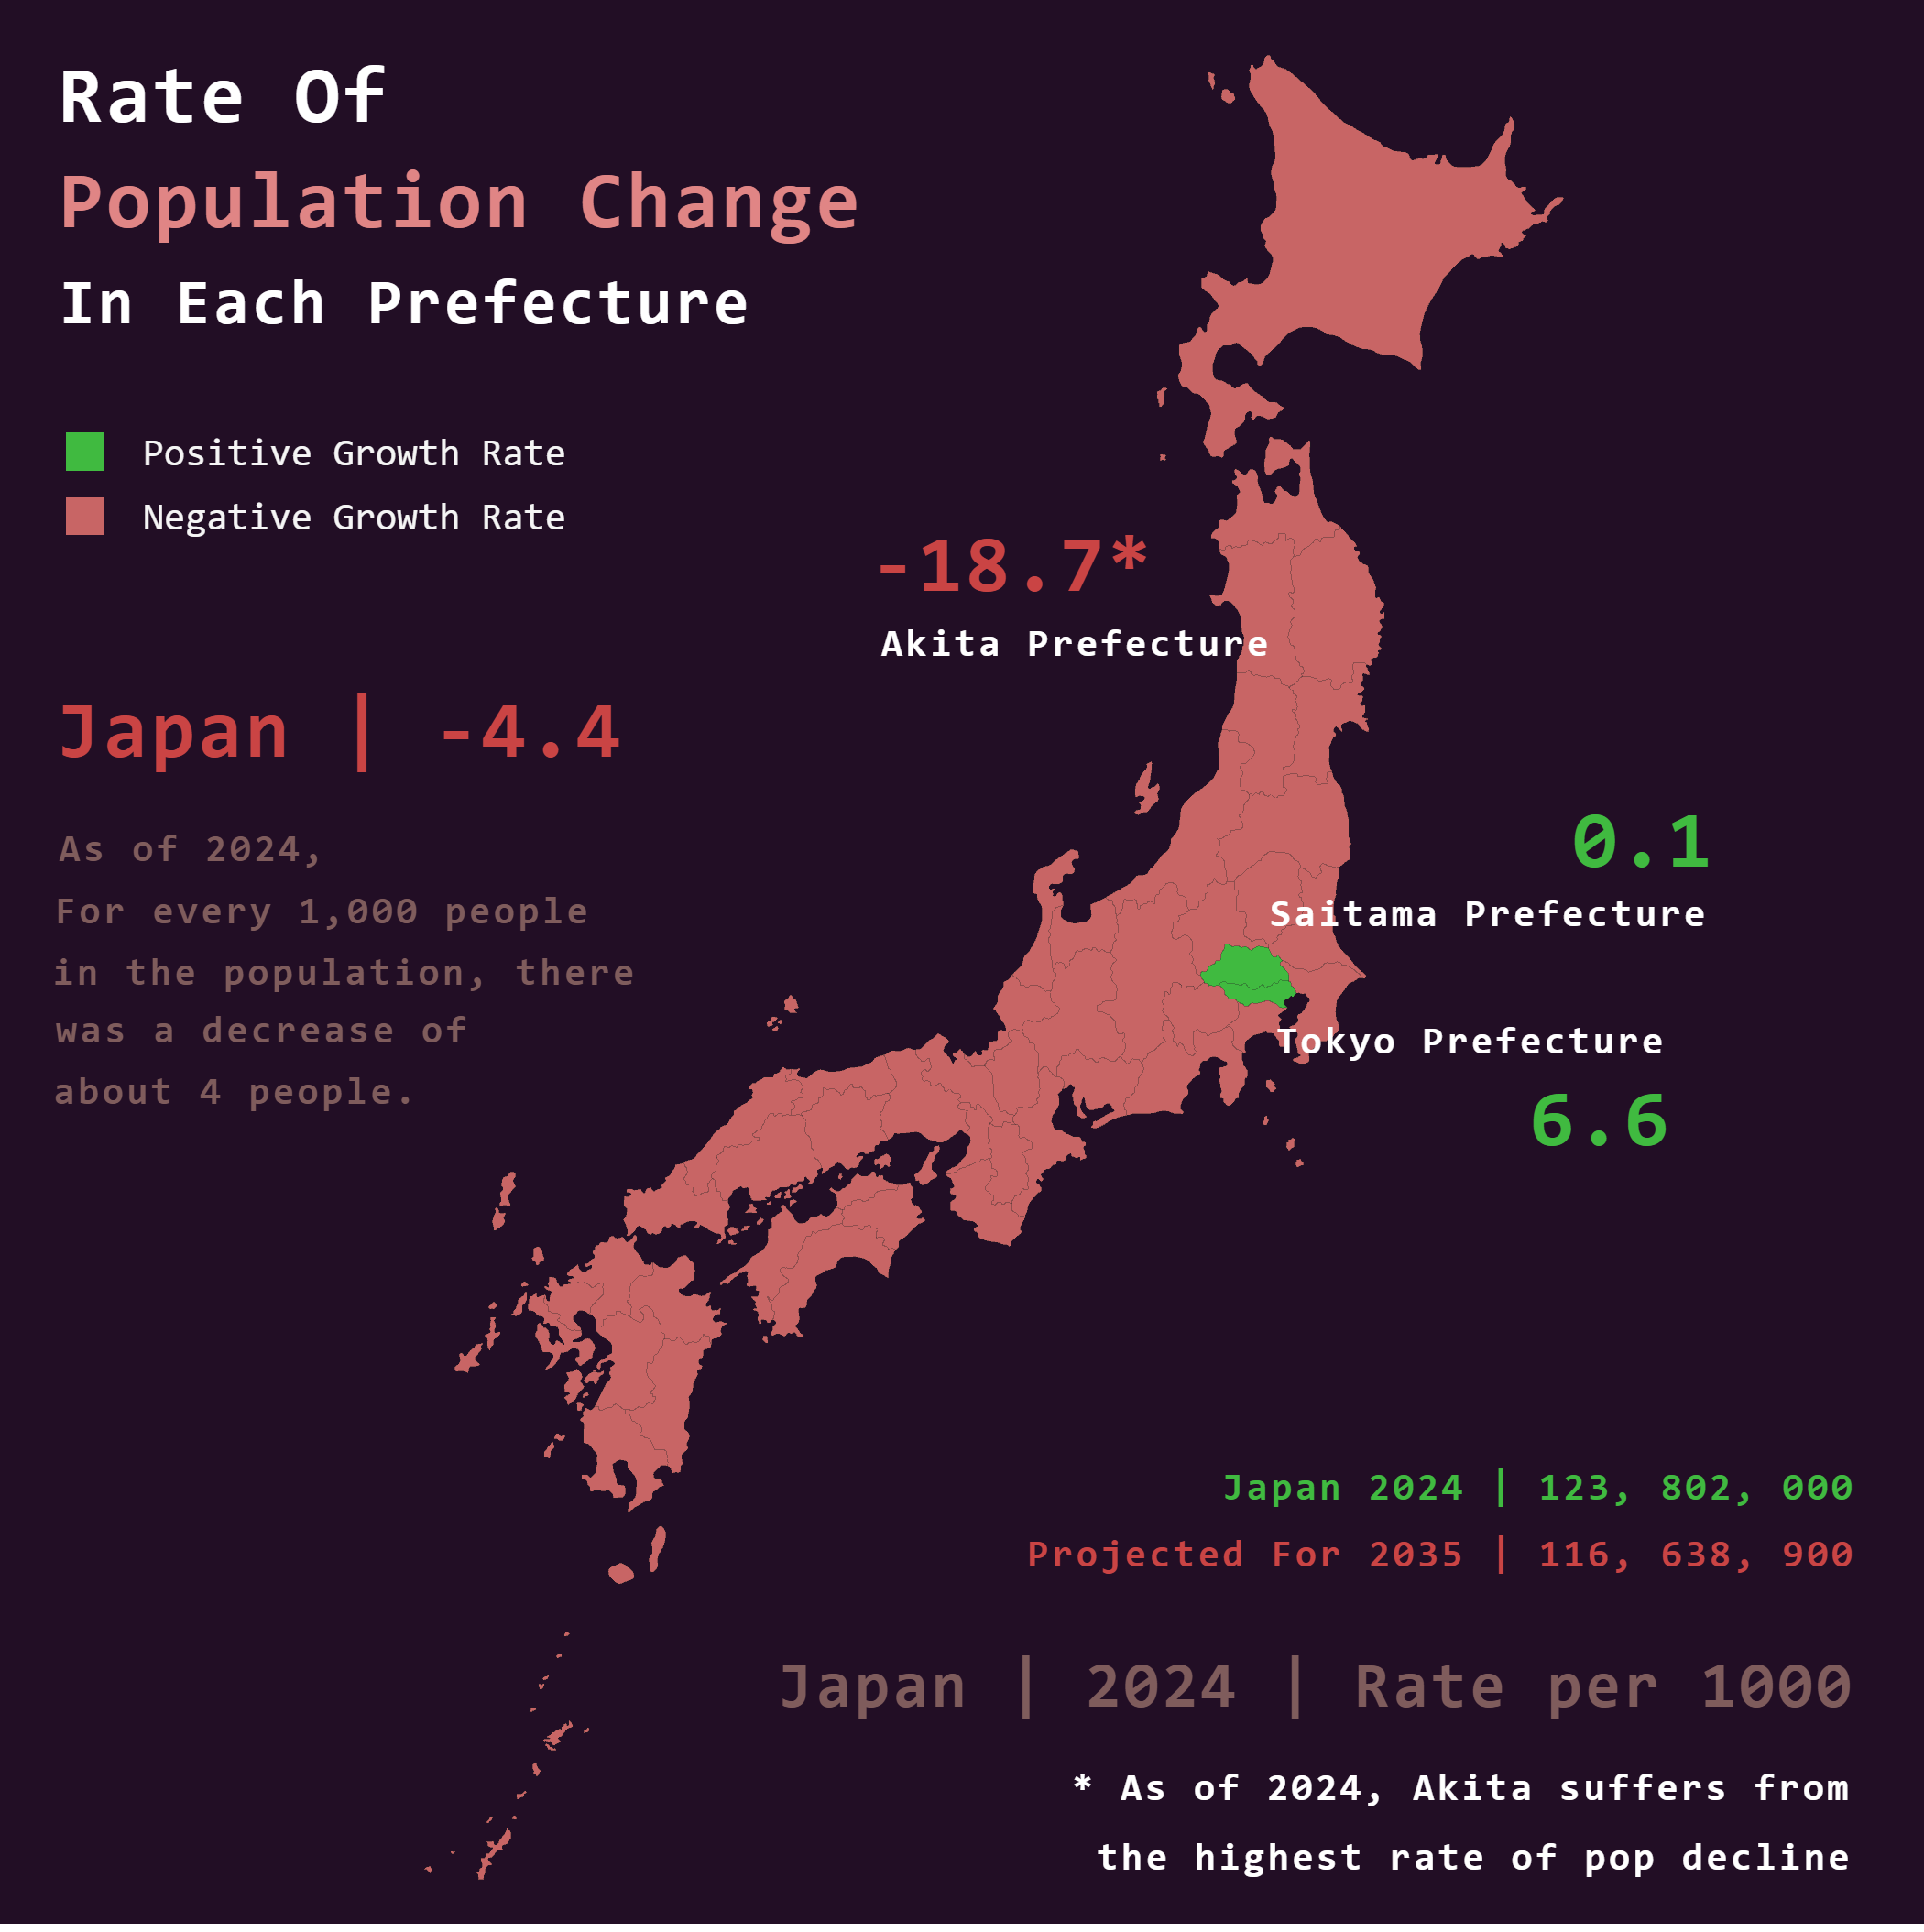
Japan Population Trend Map 2024
The visualization titled \...
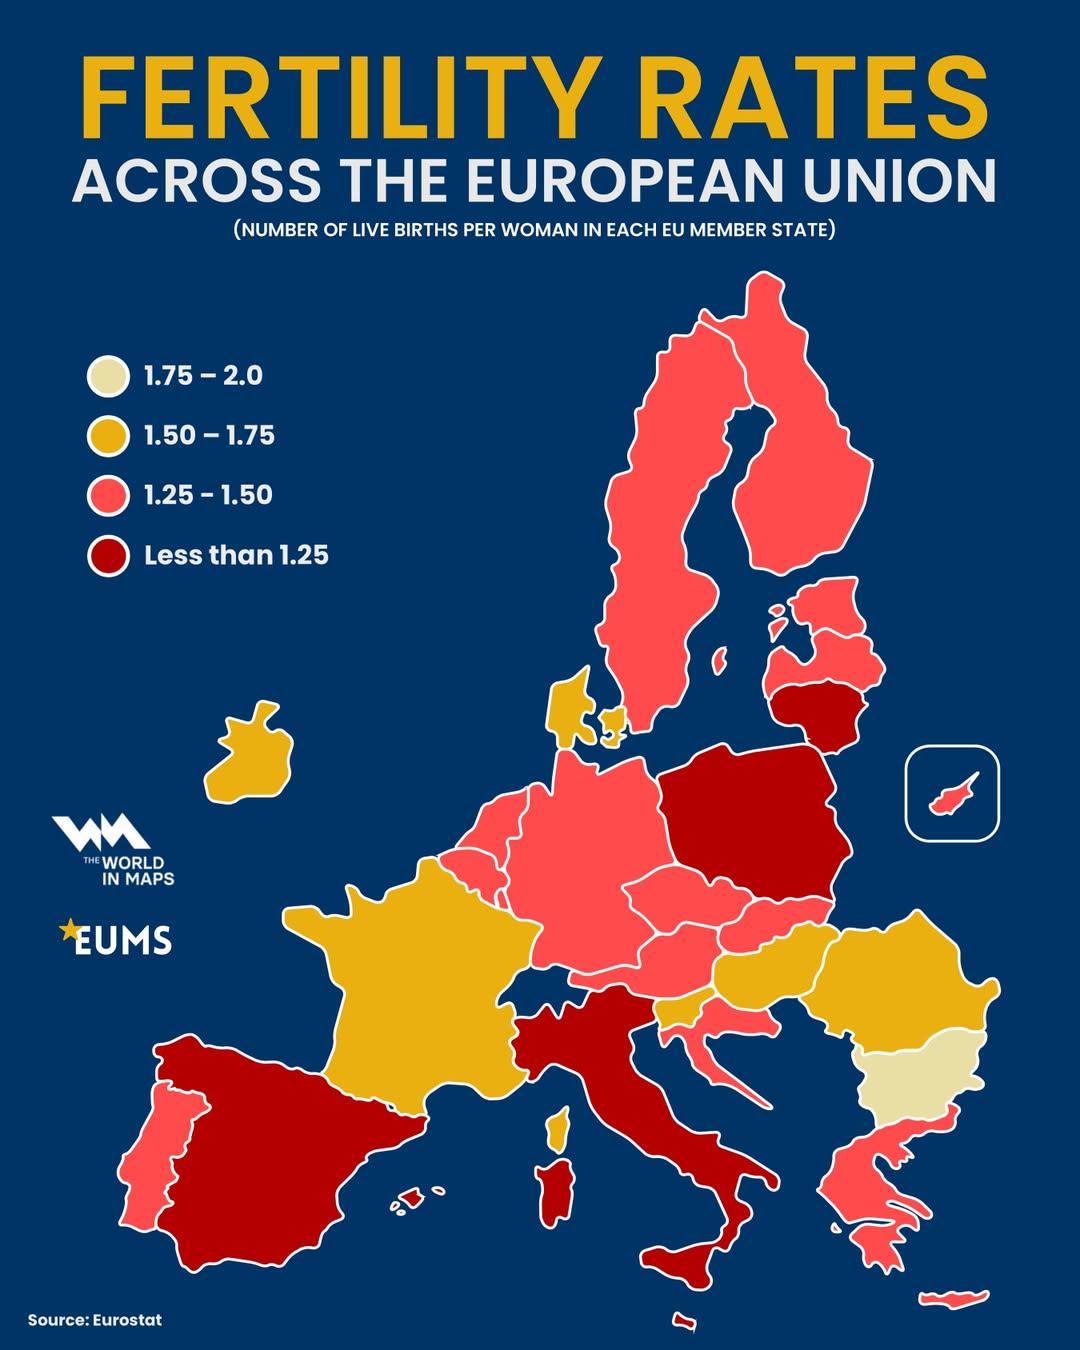
Fertility Rates Across the EU Map
The "Fertility Rates Across the EU Map" provides a comprehensive visualization of the varying fertility rates within the...
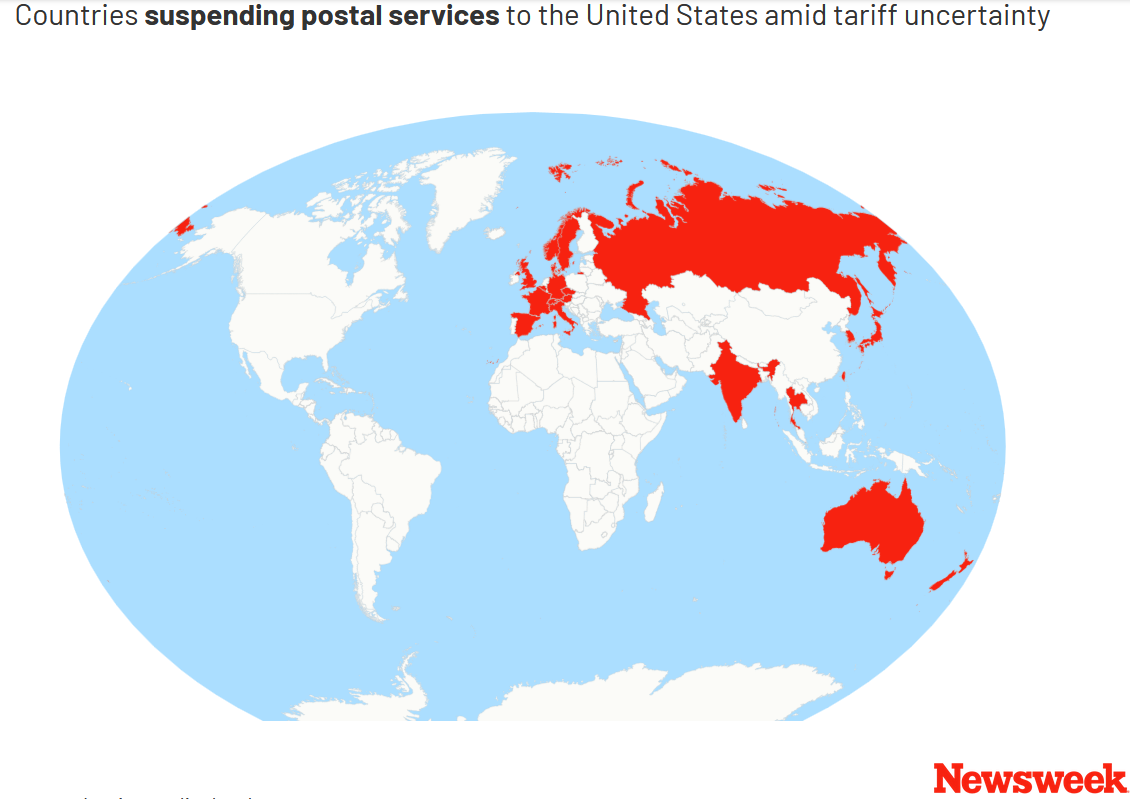
Map of Countries Suspending Postal Services to the US
This map highlights the countries that have suspended their postal services to the United States as of August 26, 2025, ...
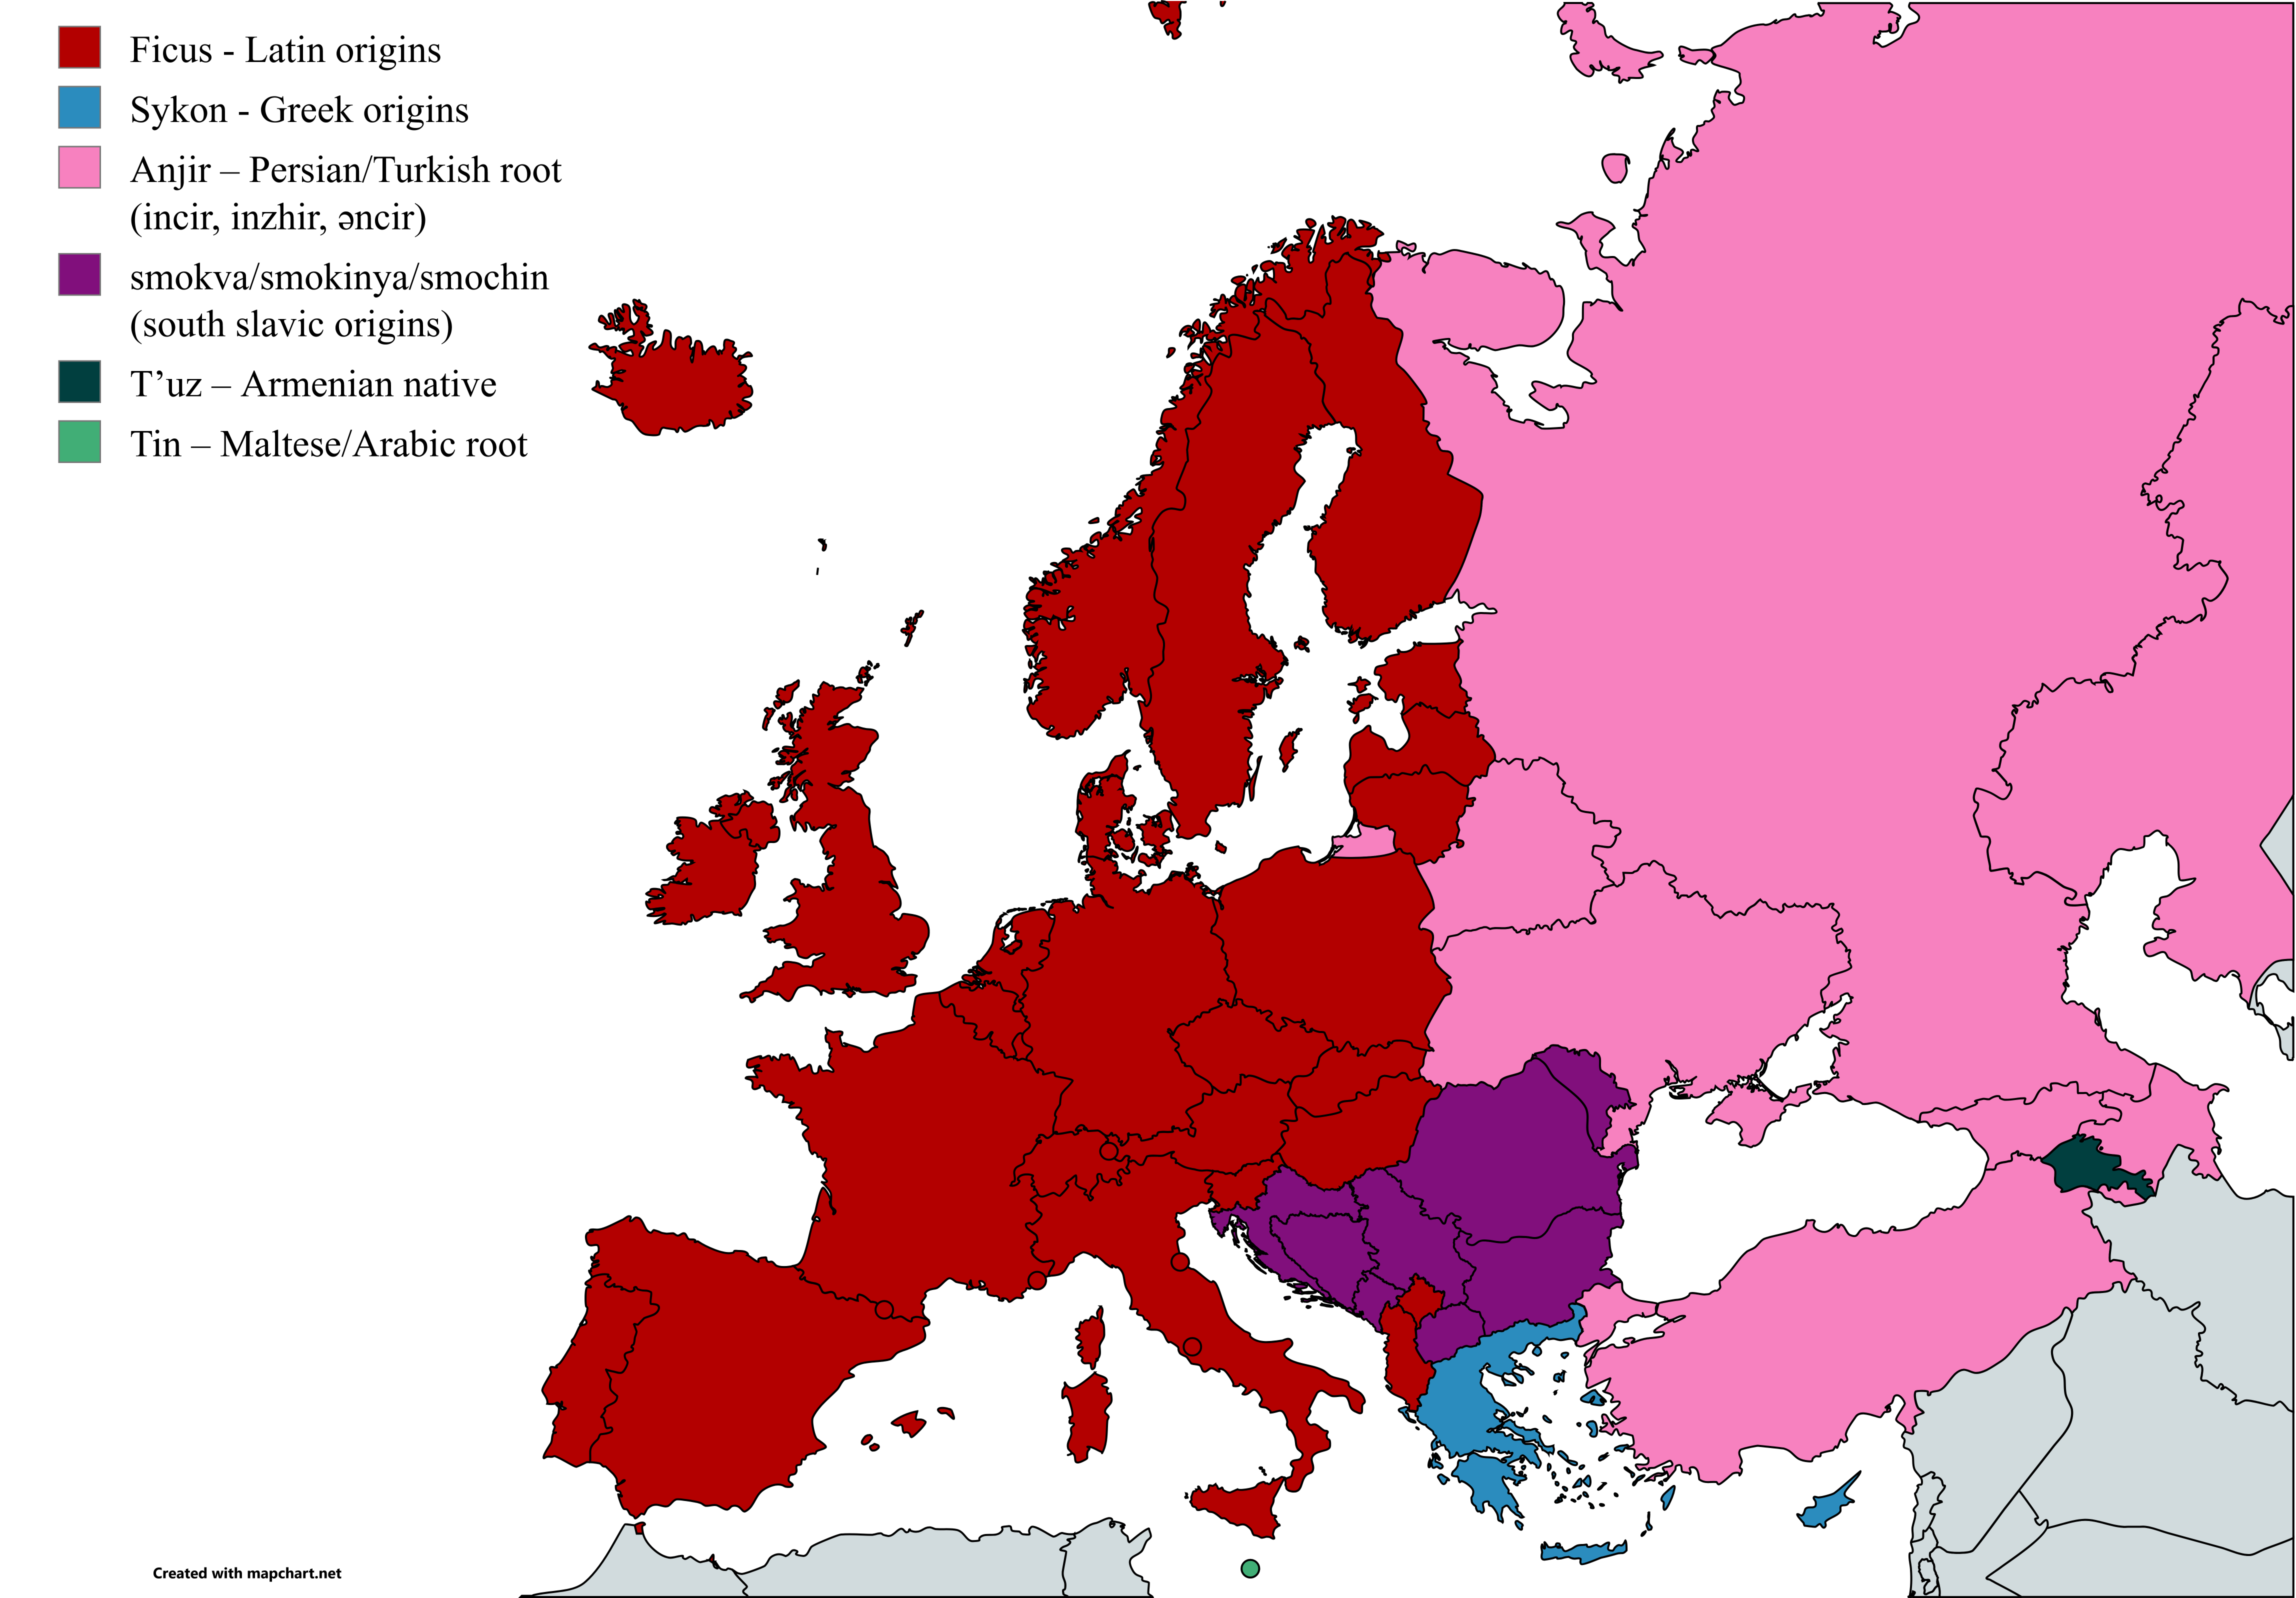
Figs Production Map of Europe
This map illustrates the distribution of fig production across Europe, highlighting the countries where figs thrive and ...
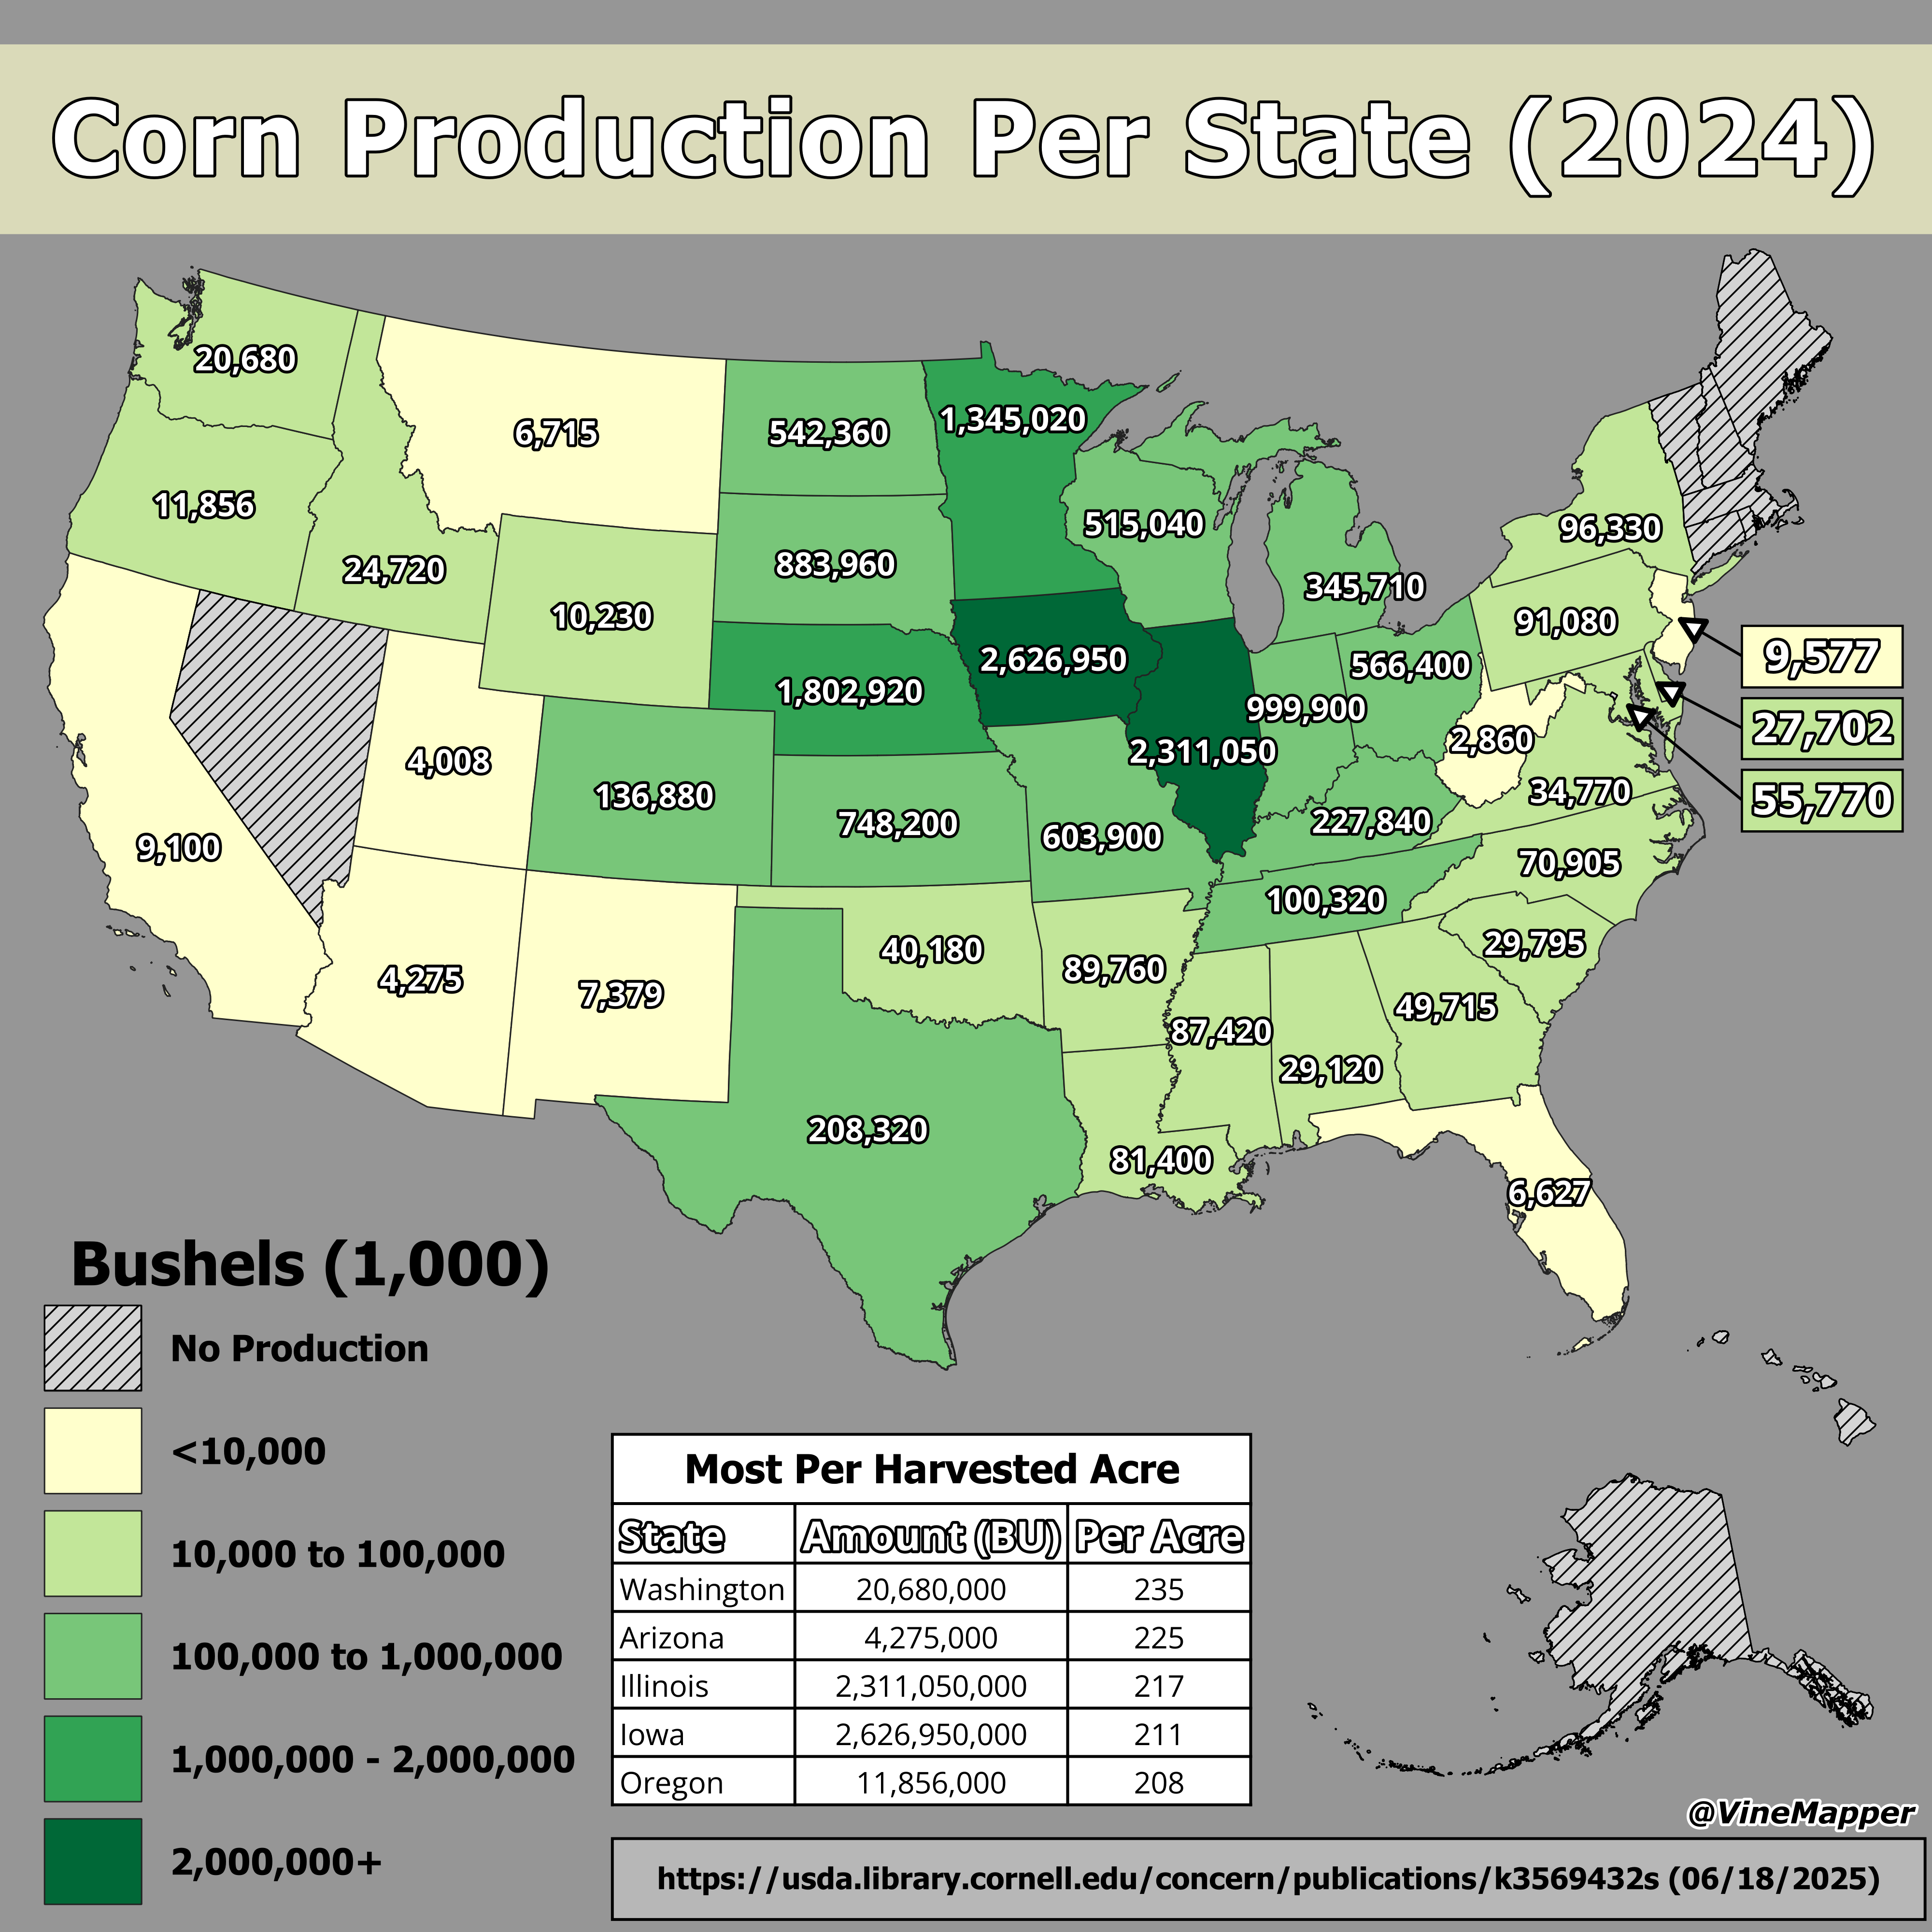
Corn Production Per State Map
This map illustrates the corn production levels across the United States, highlighting which states lead the nation in t...
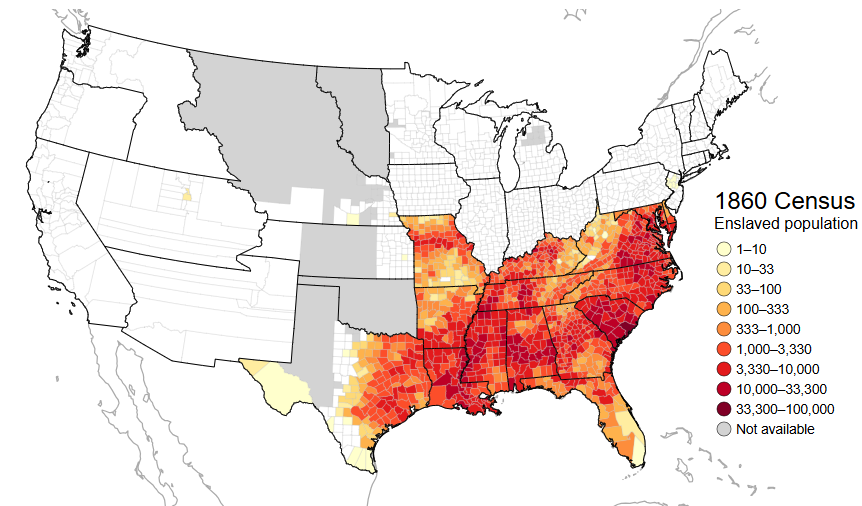
Map of US Slavery Trends 1776-1860
The map titled "The Rise and Fall of US Slavery, 1776-1860" provides a comprehensive visualization of the expansion and ...