Opioid Prescriptions by US State Map

Marcus Rodriguez
Historical Geography Expert
Marcus Rodriguez specializes in historical cartography and geographic data analysis. With a background in both history and geography, he brings unique...
Geographic Analysis
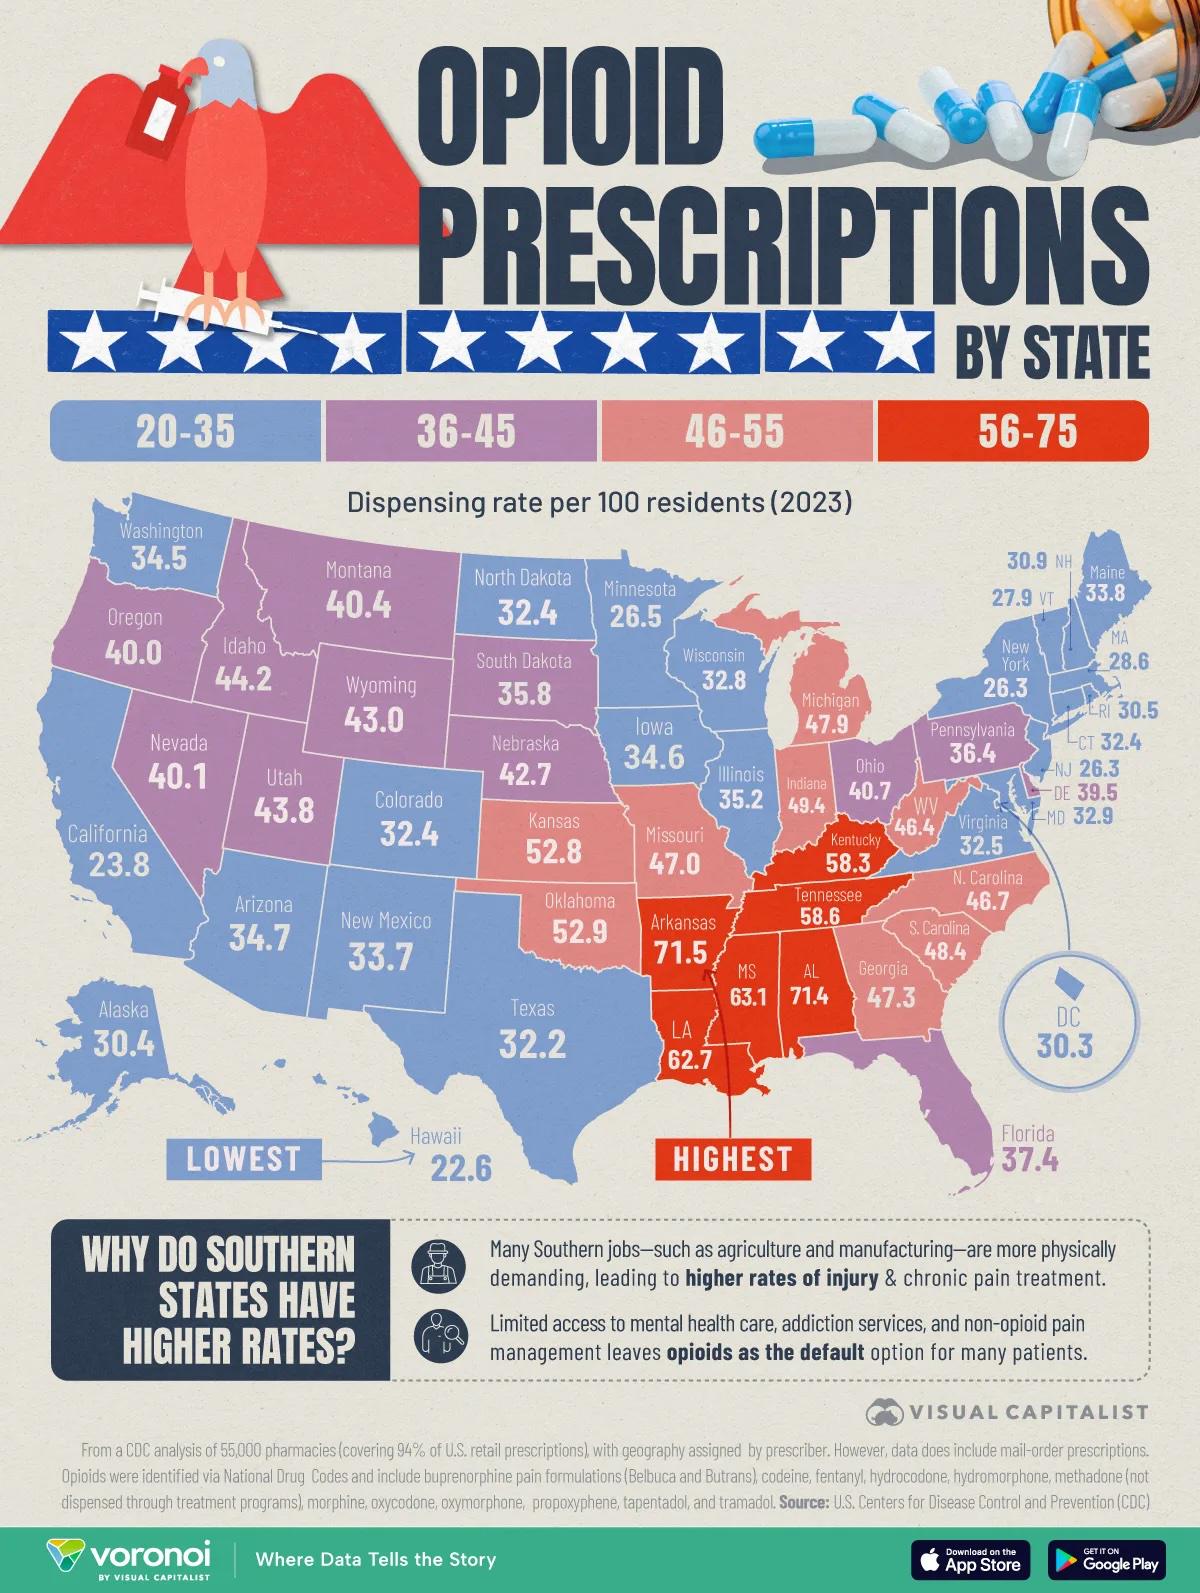
What This Map Shows
The "Opioid Prescriptions by US State Map" provides a visual representation of the distribution of opioid prescriptions across the United States. This map highlights the varying rates of opioid prescriptions issued in each state, offering a crucial insight into the current landscape of opioid use and its implications for public health. With the opioid crisis being a significant concern in recent years, understanding how prescriptions are distributed is fundamental for addressing the epidemic.
Deep Dive into Opioid Prescriptions
Opioids have been a cornerstone of pain management in medicine for decades, but their addictive nature has led to widespread misuse and a public health crisis. The Centers for Disease Control and Prevention (CDC) reports that while opioids can be effective for treating acute pain, they can also lead to long-term dependency and addiction, especially when prescribed inappropriately or for extended periods. In fact, the National Institute on Drug Abuse (NIDA) notes that nearly 21-29% of patients prescribed opioids for chronic pain misuse them.
Interestingly, the prescriptions vary widely from state to state. For instance, states like West Virginia and Alabama often report some of the highest prescription rates, while states like New York and California show comparatively lower rates. This discrepancy raises questions about the factors influencing prescription habits, including healthcare practices, state regulations, and even cultural attitudes towards pain management. Have you ever wondered why some states have significantly higher rates?
One factor contributing to these differences is the availability of healthcare resources. In states with fewer healthcare providers, patients may receive more prescriptions simply due to limited access to alternative pain management strategies. Furthermore, socioeconomic factors play a role; states with higher poverty rates may see more people reliant on opioids for pain relief without adequate access to holistic treatments. The map visually encapsulates these disparities, making it easier to identify regions that might need more focused interventions.
Regional Analysis
Analyzing the map, we can discern distinct patterns in opioid prescriptions across various U.S. regions. The Southern states, particularly those in Appalachia, have consistently reported higher prescription rates. West Virginia, for example, has been at the forefront of the crisis, with an astounding number of prescriptions written per capita. In contrast, states in the Northeast, such as Massachusetts and New Jersey, exhibit lower rates, possibly due to more stringent regulations and a greater emphasis on alternative pain management techniques.
Moreover, the Midwest presents a mixed bag. States like Ohio have seen alarming surges in prescription rates, contributing to a growing number of overdose deaths, while neighboring states may show more moderate figures. It's essential to consider local policies and public health initiatives that may either combat or exacerbate the issue. For instance, some states have implemented prescription drug monitoring programs (PDMPs) to track prescriptions and reduce misuse, showing promising results in curbing the crisis.
Significance and Impact
Understanding the landscape of opioid prescriptions is crucial for addressing the ongoing crisis. The ramifications of high prescription rates extend beyond individual health; they affect communities, healthcare systems, and even law enforcement agencies. The opioid epidemic has led to increased rates of addiction, a spike in overdose deaths, and a strain on public resources. In 2021 alone, over 100,000 people died from drug overdoses in the U.S., with a significant portion attributed to opioids.
Looking ahead, there is a pressing need for comprehensive strategies that not only address prescription practices but also promote education and alternative pain management options. As states continue to adapt their policies in response to the crisis, monitoring these changes through maps like the one presented can be invaluable. Trends indicate that states with proactive measures, such as increased access to addiction treatment services and educational campaigns, tend to have lower prescription rates and better health outcomes. Ultimately, this map serves as a vital tool for understanding the complexity of opioid prescriptions and the multifaceted approach needed to tackle this public health challenge effectively.
Visualization Details
- Published
- October 22, 2025
- Views
- 34
Comments
Loading comments...