US Farm Subsidies by County Map

Alex Cartwright
Senior Cartographer & GIS Specialist
Alex Cartwright is a renowned cartographer and geographic information systems specialist with over 15 years of experience in spatial analysis and data...
Geographic Analysis
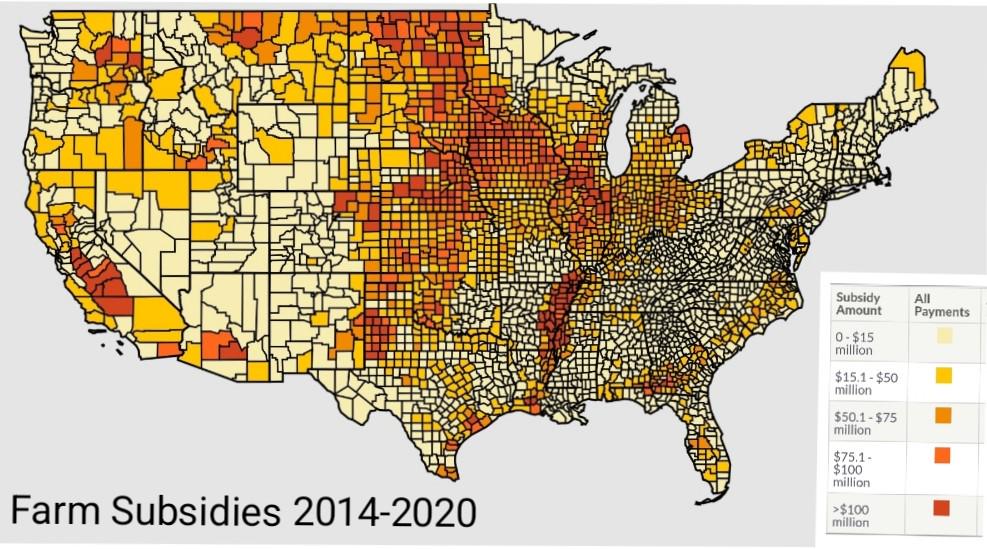
What This Map Shows
The "US Farm Subsidies by County Map" provides a visual representation of how federal farm subsidies are distributed across different counties in the United States. This map illustrates the total amount of subsidies received by each county, showcasing the financial support provided to farmers and agricultural producers. By analyzing this data, we can gain insights into agricultural practices, economic dependencies, and the regional disparities that exist within the country's farming landscape.
Deep Dive into US Farm Subsidies
Farm subsidies are financial assistance programs provided by the government to support farmers and stabilize agricultural markets. These subsidies can take various forms, including direct payments, crop insurance, conservation programs, and disaster relief. The intention behind these financial aids is to ensure food security, promote sustainable farming practices, and provide a safety net for farmers in times of economic distress.
Interestingly, the distribution of farm subsidies is not uniform across the United States. States with large agricultural sectors, such as Iowa, Texas, and California, often receive the highest amounts of subsidies. For example, in 2020, Iowa received approximately $1.6 billion in farm subsidies, primarily due to its extensive corn and soybean production. In contrast, counties with smaller agricultural operations may receive significantly less, highlighting a key disparity in how these funds are allocated.
What’s fascinating is that the types of subsidies can vary widely depending on the region and the crops being grown. For instance, Southern states tend to receive more funding for cotton and rice, while Midwestern states focus more on corn and soybeans. This variation reflects the agricultural diversity and the economic needs of different regions.
Moreover, the debate over farm subsidies often centers around their effectiveness and fairness. Critics argue that these subsidies disproportionately benefit large agribusinesses rather than small family farms. In fact, about 10% of farms receive nearly 75% of all subsidies, which raises questions about equity and the future of farming in America. As the agricultural landscape evolves, understanding the dynamics of these subsidies becomes increasingly critical for policymakers.
Regional Analysis
When examining the map, it’s clear that different regions of the United States show distinct patterns in farm subsidy distributions. The Midwest, often referred to as the Corn Belt, is characterized by high subsidy amounts due to its vast fields of corn and soybeans. States like Illinois and Indiana also feature prominently, with significant federal support aiding their agricultural sectors.
On the other hand, the Southern states, particularly those like Arkansas and Mississippi, have a different profile. Here, the subsidies are heavily tied to crops such as cotton and rice. For instance, Arkansas received around $600 million in subsidies in 2020, largely attributed to cotton farming. In contrast, the Northeast, with its smaller farming operations focused on dairy and vegetables, tends to receive lower subsidy amounts relative to the size of the agricultural sector.
Interestingly, Western states present a unique case. States like California, known for their diverse agricultural output, receive substantial subsidies too, but these are often tied to water conservation and sustainable farming practices due to the region's ongoing drought issues. This illustrates how environmental factors can influence agricultural policy and subsidy distribution.
Significance and Impact
Understanding farm subsidies is crucial for several reasons. First, they play a vital role in shaping the agricultural economy and influencing food prices across the country. Farmers depend on these subsidies to maintain their livelihoods, especially in the face of fluctuating market prices and unpredictable weather conditions.
Moreover, the implications of these subsidies extend beyond agriculture. They impact rural communities, local economies, and even national food security. For instance, when a county receives substantial subsidies, it can lead to increased investment in local infrastructure and services, ultimately benefiting the entire community.
Current trends indicate that as climate change affects agricultural practices, discussions around farm subsidies may shift. There is a growing emphasis on sustainable farming and environmental stewardship, which could lead to changes in how subsidies are allocated in the future. Policymakers are increasingly considering how to incentivize practices that promote conservation and reduce the environmental impact of farming.
In conclusion, the "US Farm Subsidies by County Map" not only serves as a tool for visualizing financial distributions but also opens up a broader dialogue about the future of agriculture in America. By understanding these subsidy patterns, we can better appreciate the complexities of farming and its critical role in our society.
Visualization Details
- Published
- October 21, 2025
- Views
- 32
Comments
Loading comments...