Employment Rate by NUTS 2 Regions Map

Alex Cartwright
Senior Cartographer & GIS Specialist
Alex Cartwright is a renowned cartographer and geographic information systems specialist with over 15 years of experience in spatial analysis and data...
Geographic Analysis
What This Map Shows
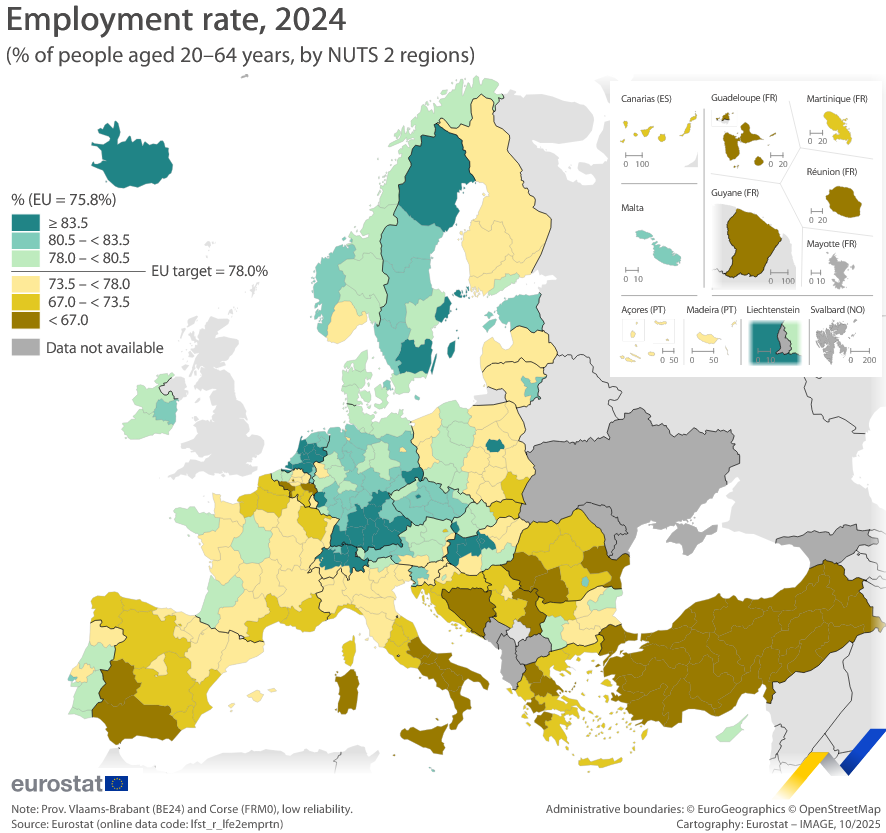
The "Employment Rate in the EU, by NUTS 2 Regions" map provides an insightful visualization of employment statistics across various regions within the European Union. This map, sourced from Eurostat data for 2024, categorizes employment rates according to the Nomenclature of Territorial Units for Statistics (NUTS) classification, which divides the EU into regions based on economic and social characteristics. The color coding on the map vividly illustrates where employment rates are high and low, allowing for quick visual comparisons and a deeper understanding of economic disparities.
Deep Dive into Employment Trends in the EU
Employment is a fundamental aspect of economic health and social stability. The employment rate indicates the proportion of the working-age population that is currently employed, and it serves as a vital measure of a region's economic vitality. In the context of the EU, this rate can reveal significant disparities rooted in various factors, including economic structure, education levels, and local industry presence.
Interestingly, the employment rate in the EU has shown a general upward trend over the last decade, recovering from the economic downturn experienced during the global financial crisis. As of 2024, the overall employment rate in the EU stands at approximately 73%, but this figure masks considerable regional variations. For instance, Northern European countries, particularly the Nordic nations, tend to exhibit some of the highest employment rates, often exceeding 80%. On the flip side, Southern and Eastern European regions often report lower rates, sometimes dipping below 60%.
One of the critical factors influencing employment rates is the structure of the local economy. Regions with diverse economies, strong service sectors, and robust industrial bases typically boast higher employment rates. For instance, urban areas like Frankfurt in Germany or Amsterdam in the Netherlands benefit from their status as financial and technological hubs, attracting a skilled workforce and providing numerous job opportunities.
Conversely, regions that rely heavily on traditional industries or have a narrow economic base may struggle with higher unemployment. For example, some regions in Greece and Spain have faced persistent challenges due to reliance on tourism and agriculture, sectors that are often vulnerable to economic fluctuations.
Regional Analysis
When examining the employment rate map, it's essential to consider specific regions and their unique characteristics. In Germany, the NUTS 2 regions exhibit significant differences. Bavaria, known for its strong manufacturing and automotive industries, enjoys one of the highest employment rates in the country, while regions in Eastern Germany, like Saxony-Anhalt, often report lower rates, struggling with post-industrial transitions.
In Italy, the North-South divide is stark. Northern regions like Lombardy and Emilia-Romagna enjoy robust employment figures, largely due to their industrial strength and innovation. In contrast, Southern regions such as Calabria and Sicily face challenges, with employment rates significantly lower due to economic stagnation and migration of the workforce seeking opportunities elsewhere.
Moreover, the map highlights the disparities in Eastern Europe. Countries like Poland have seen a remarkable improvement in employment rates due to economic reforms and EU integration, with regions such as Mazovia (home to Warsaw) showcasing high employment rates. However, regions in Bulgaria and Romania still grapple with lower rates, hindered by economic transition issues and lower investment levels.
Significance and Impact
Understanding employment rates across the EU is crucial for policymakers, economists, and social planners. High employment not only indicates economic health but also correlates with social stability and quality of life. Regions with lower employment rates often face challenges such as increased poverty, social unrest, and diminished public services due to reduced tax revenues.
As we look toward the future, the implications of these employment trends are significant. The ongoing digital transformation and the shift towards green economies are expected to reshape labor markets across the EU. Jobs in technology, renewable energy, and healthcare are projected to grow, while traditional jobs may decline. Regions that adapt to these changes and invest in education and skills training are likely to see improvements in their employment rates.
In conclusion, the employment rate by NUTS 2 regions map not only provides a snapshot of the current economic landscape but also serves as a tool for understanding the underlying factors that shape employment across Europe. As we continue to navigate an ever-changing economic environment, these insights will be vital for fostering inclusive growth and addressing regional disparities.
Visualization Details
- Published
- October 13, 2025
- Views
- 38
Comments
Loading comments...