Violent Crime Rates by U.S. State Map

Marcus Rodriguez
Historical Geography Expert
Marcus Rodriguez specializes in historical cartography and geographic data analysis. With a background in both history and geography, he brings unique...
Geographic Analysis
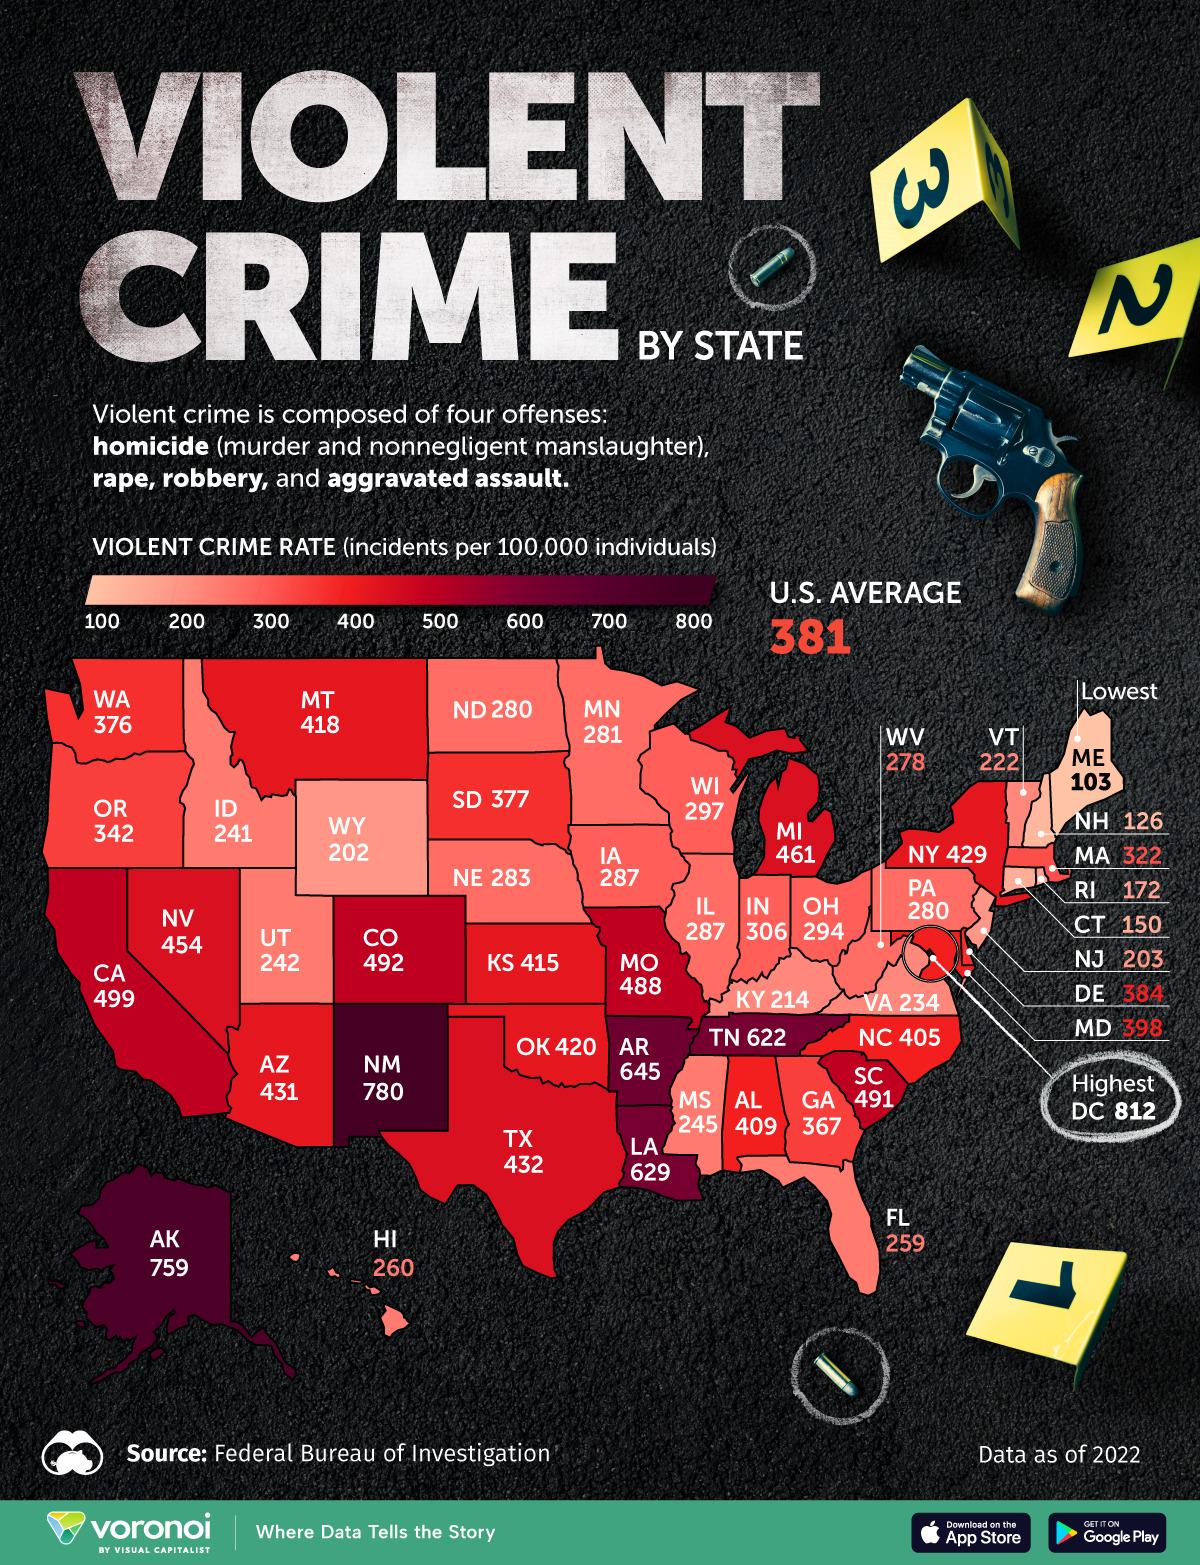
What This Map Shows
The "Violent Crime Rates by U.S. State" map provides a clear visualization of the varying levels of violent crime across the United States, categorizing each state based on its reported incidents per capita. This map is essential for understanding the geographic distribution of violent crime, shedding light on the states that face higher risks and those that maintain lower rates. It serves as a vital tool for policymakers, law enforcement, and the public, allowing for informed discussions about safety, crime prevention, and social issues.
Deep Dive into Violent Crime
Violent crime encompasses a range of offenses, including homicide, rape, robbery, and aggravated assault. According to the Federal Bureau of Investigation (FBI), in recent years, the national violent crime rate has fluctuated, reflecting broader social, economic, and political trends. In 2020, the U.S. saw a notable increase in violent crime, with the rate rising to approximately 387 incidents per 100,000 people, up from about 366 in 2019. What’s fascinating is how these rates can vary dramatically from state to state due to a variety of factors.
Several elements contribute to the disparities in violent crime rates across the nation. Socioeconomic factors play a significant role; states with higher poverty rates and lower levels of education often experience elevated crime levels. For instance, states like New Mexico and Louisiana have consistently reported some of the highest violent crime rates, often linked to economic struggles and systemic issues.
Interestingly, urbanization also impacts crime rates. States with large metropolitan areas, such as California and New York, may report higher numbers of violent crimes simply due to their larger populations. However, within these states, crime can be concentrated in particular neighborhoods, showing that local conditions, community resources, and policing strategies can greatly influence crime outcomes.
Moreover, cultural factors and gun laws also play a part in shaping violent crime rates. States with stricter gun control measures, like Massachusetts, generally report lower rates of violent crime compared to states with more lenient laws, such as Alaska. The relationship between gun ownership and crime is a complex and often debated topic, highlighting the need for comprehensive approaches to crime prevention.
Regional Analysis
Analyzing the map regionally reveals significant trends. For instance, the South often ranks as the region with the highest average violent crime rates, with states like Alabama and Tennessee leading the pack. This trend can be attributed to a combination of economic conditions, educational disparities, and historical factors that have shaped these areas.
Conversely, the Northeast tends to have some of the lowest violent crime rates in the country. States like New York and New Jersey illustrate how effective community programs, proactive policing, and socioeconomic stability can yield positive outcomes in crime prevention. These states have implemented various initiatives aimed at reducing violence, emphasizing the importance of community engagement.
The Midwest presents a mixed picture. While states like Minnesota report relatively low crime rates, others like Michigan show higher rates, particularly in urban areas. The differences within the Midwest highlight how local policies and community resources can significantly impact crime levels.
Significance and Impact
Understanding violent crime rates is not just about statistics; it's crucial for public safety and social policies. High levels of violent crime can lead to fear and anxiety within communities, impacting everything from property values to local economies. Furthermore, the implications extend beyond mere numbers, influencing legislation, funding for social programs, and community policing strategies.
As crime rates fluctuate, it’s important to remain aware of the underlying causes and trends. Current discussions around social justice, inequality, and policing have sparked renewed interest in addressing violent crime in America. There’s a growing recognition that tackling root causes, such as poverty and lack of access to education, is essential for reducing crime rates in the long term. Future projections suggest that without significant intervention, we may see continued challenges in states with persistently high violent crime rates.
In conclusion, the "Violent Crime Rates by U.S. State" map not only illustrates where crime occurs but also invites a deeper conversation about the factors contributing to these rates and the necessary steps to create safer communities across the nation.
Visualization Details
- Published
- October 8, 2025
- Views
- 42
Comments
Loading comments...