Map of Alcohol Consumption by U.S. County

David Chen
Data Visualization Specialist
David Chen is an expert in transforming complex geographic datasets into compelling visual narratives. He combines his background in computer science ...
Geographic Analysis
What This Map Shows
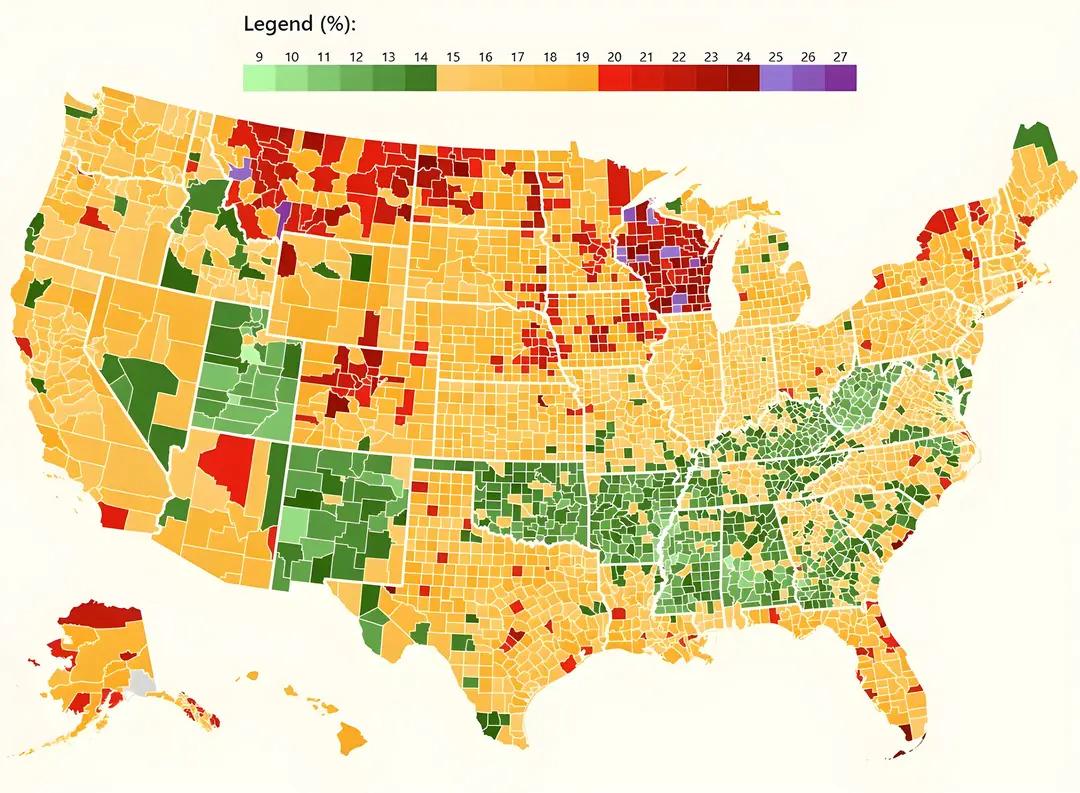
The map titled "Map showing how much alcohol people drink in every U.S. county" provides a comprehensive overview of alcohol consumption patterns across the United States. With counties shaded in purple indicating the highest drinking rates and those in green representing the lowest, this visualization offers a clear and immediate understanding of where alcohol consumption is most prevalent and where it is less common. Alcohol consumption can reveal much about social habits, cultural attitudes, and health trends in different regions.
Deep Dive into Alcohol Consumption in the U.S.
Alcohol consumption is a complex topic influenced by a myriad of factors, including culture, economics, and social norms. According to the National Institute on Alcohol Abuse and Alcoholism, the average American adult consumes about 2.3 gallons of alcohol per year. However, this average belies significant regional differences that can be seen in this map.
Interestingly, states with higher alcohol consumption often correlate with specific social environments. For instance, areas with a vibrant nightlife, college towns, or states with liberal alcohol laws tend to show higher consumption rates. In contrast, regions with stricter alcohol regulations or more conservative social norms may exhibit lower drinking rates.
The implications of these consumption patterns are significant. High levels of alcohol consumption are associated with various health issues, including liver disease, addiction, and a range of social problems such as drunk driving incidents and domestic violence. Furthermore, the Centers for Disease Control and Prevention (CDC) reports that excessive alcohol consumption contributes to over 95,000 deaths annually in the U.S. This statistic highlights the need for ongoing public health initiatives aimed at addressing alcohol-related harm, especially in counties marked in darker shades of purple on the map.
Additionally, economic factors play a role in alcohol consumption. Areas with lower socioeconomic status may experience higher rates of alcohol-related issues, as stress and unemployment can lead individuals to seek solace in alcohol. Interestingly, some studies suggest that rural areas, often depicted in lighter green shades, may have lower overall consumption rates, but can suffer from higher incidences of alcohol-related problems due to limited access to healthcare and support services.
Regional Analysis
When examining the map closely, distinct patterns emerge across various regions of the U.S. For example, the Midwest and parts of the South tend to show higher rates of alcohol consumption. States like Wisconsin and Colorado are often highlighted for their vibrant drinking cultures, with the former famously known for its beer brewing traditions. According to data from the CDC, Wisconsin leads the nation with the highest rate of excessive drinking, where nearly 25% of adults report binge drinking at least once a month.
Conversely, states in the Southeast, such as Alabama and Mississippi, are illustrated in lighter shades of green, indicating lower consumption rates. This can be attributed to cultural factors, including religious beliefs that discourage drinking. Interestingly, even within states, you can find varying rates of alcohol consumption. For instance, urban areas often report higher consumption rates compared to rural counterparts, revealing a complex relationship between geography and social behavior.
Significance and Impact
Understanding alcohol consumption patterns is crucial for multiple reasons. First and foremost, these insights can guide public health policies and targeted interventions aimed at reducing the negative impacts of excessive drinking. Local governments can implement educational campaigns, improve access to treatment facilities, and enforce regulations that mitigate alcohol-related harm.
Moreover, the COVID-19 pandemic has dramatically affected drinking habits, with many individuals reporting increased consumption during lockdowns. This shift raises concerns about long-term public health implications and the need for ongoing research and support. As drinking patterns continue to evolve, it is essential for policymakers and communities to stay informed and responsive to these changes.
In conclusion, the map illustrating alcohol consumption across U.S. counties is more than just a visual representation; it reflects the cultural, social, and economic fabric of America. By understanding these patterns, we can work toward healthier communities and promote responsible drinking behaviors for future generations.
Visualization Details
- Published
- October 2, 2025
- Views
- 52
Comments
Loading comments...