Map of Percentage of Black American Prisoners in USA

David Chen
Data Visualization Specialist
David Chen is an expert in transforming complex geographic datasets into compelling visual narratives. He combines his background in computer science ...
Geographic Analysis
What This Map Shows
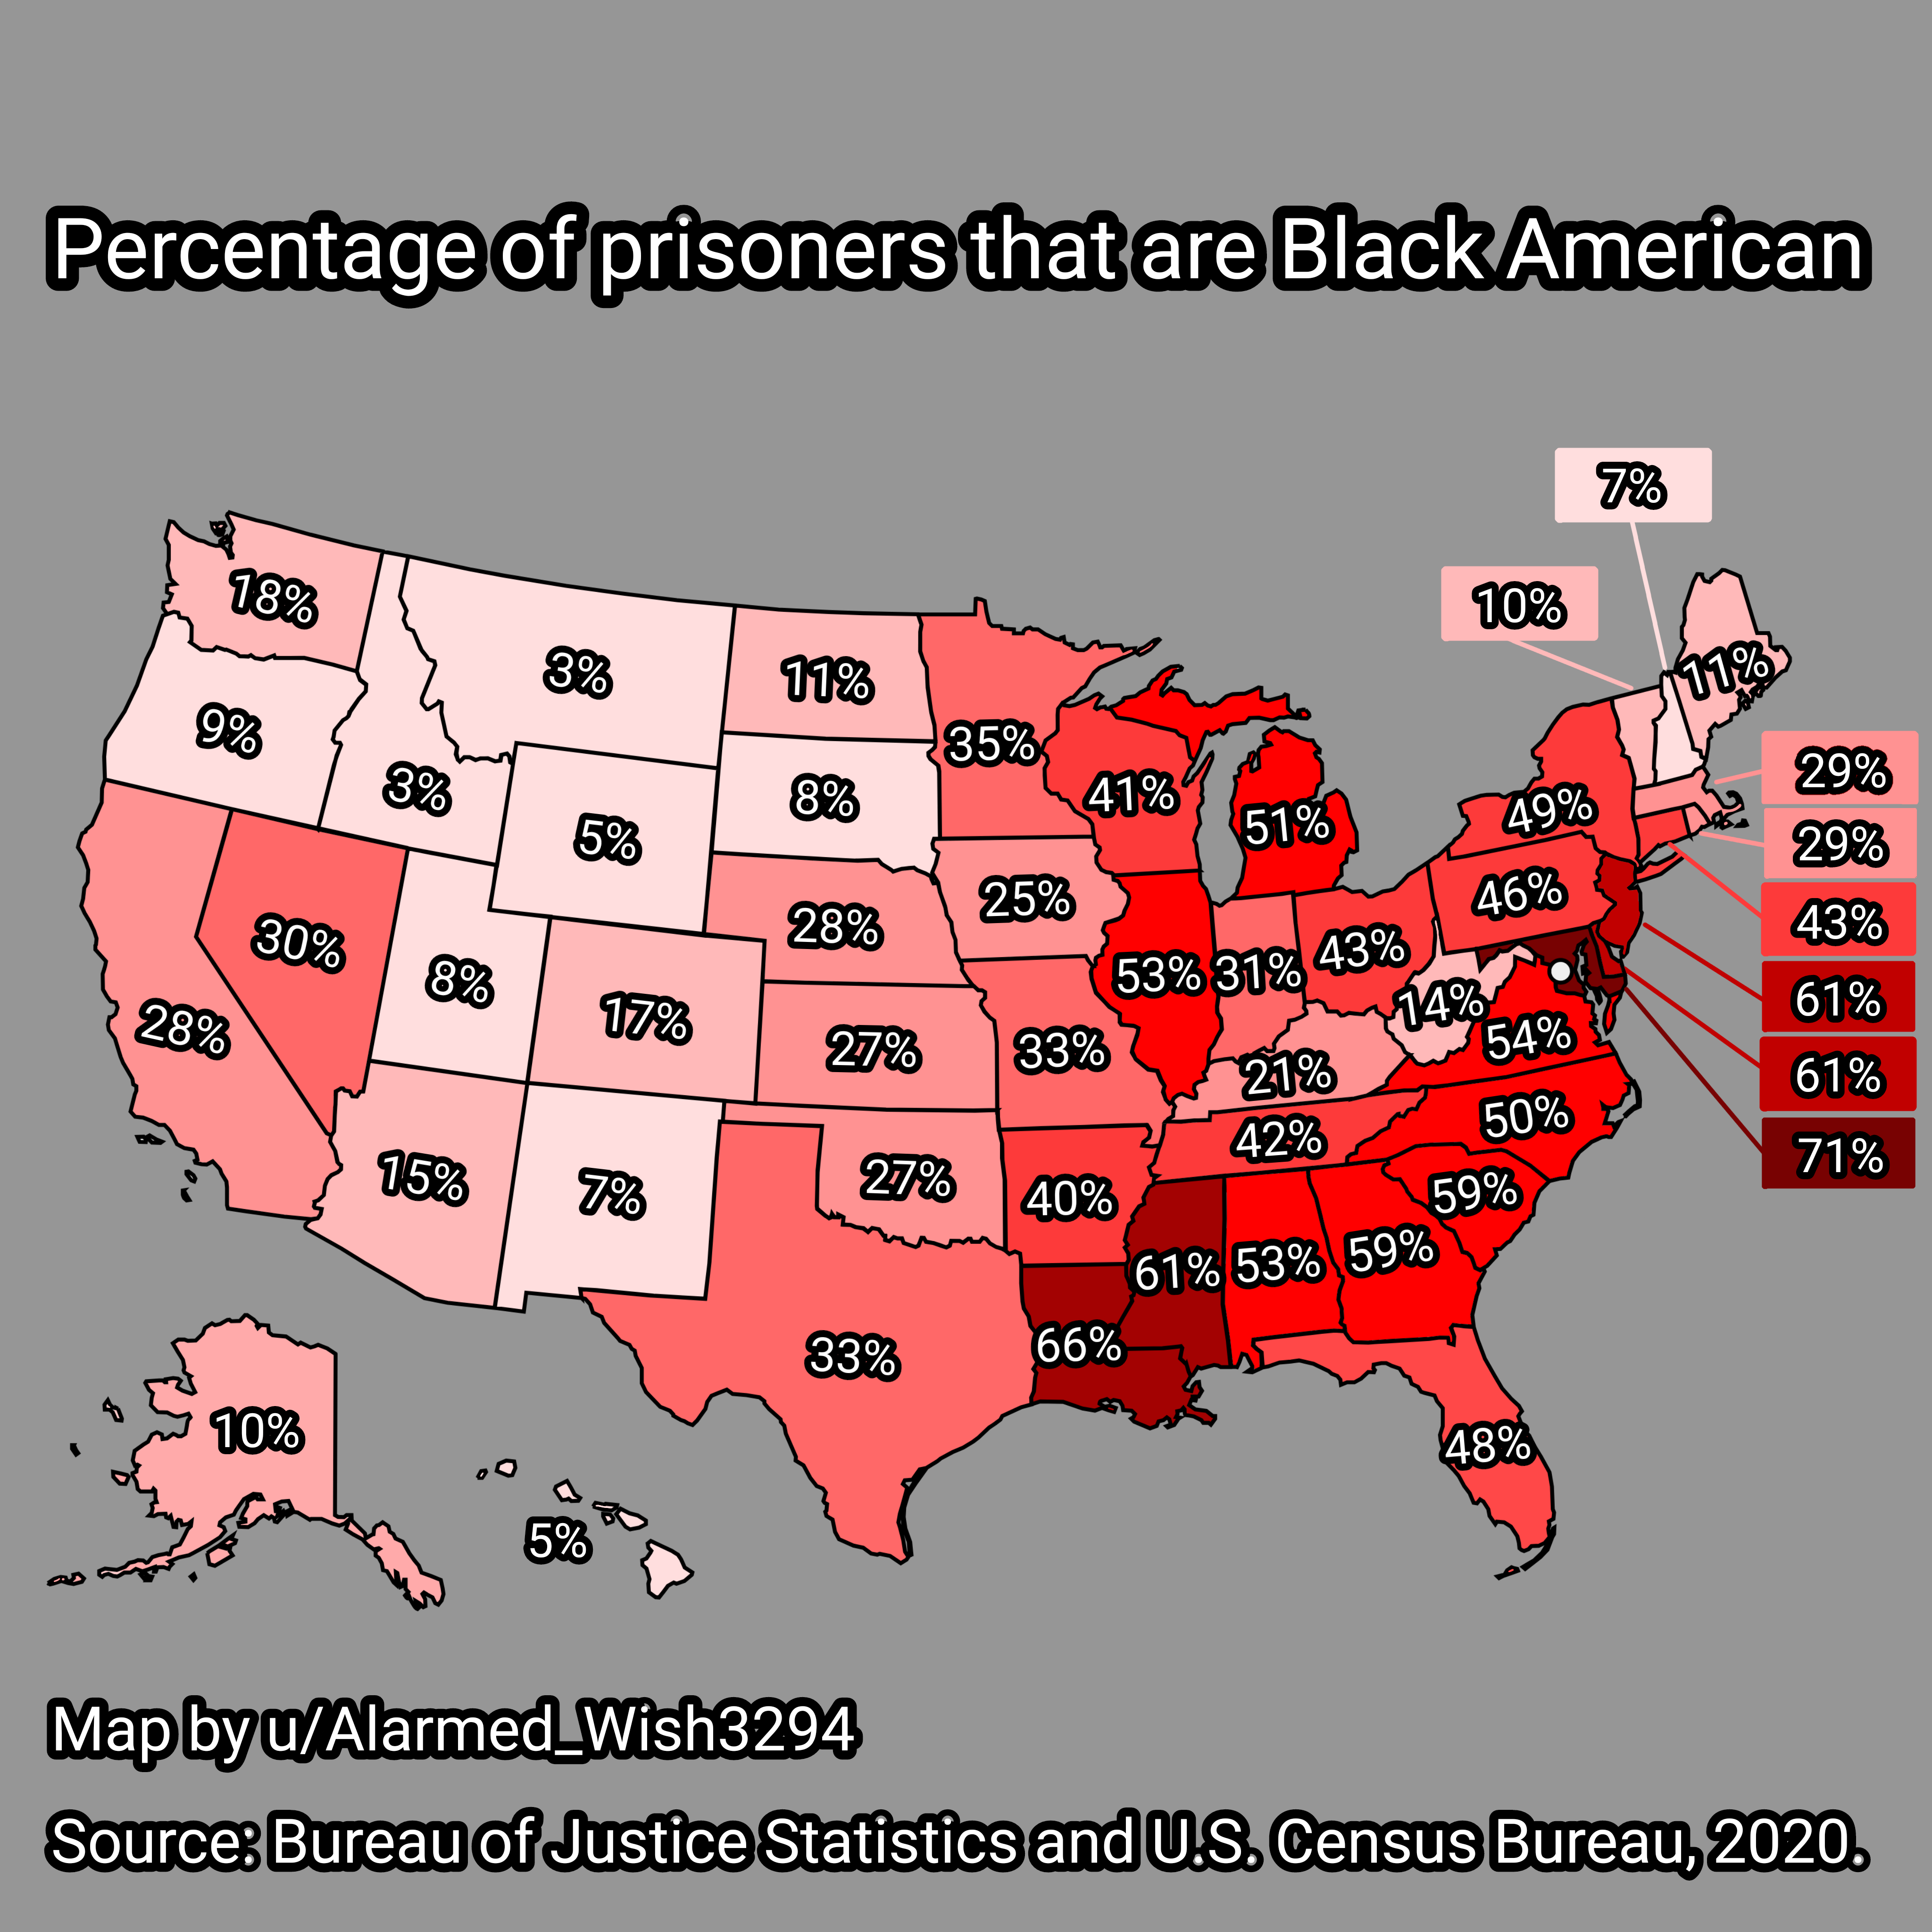
The map titled "Percentage of Black American Prisoners in USA" provides a striking visual representation of the racial demographics within the prison system across the United States. It illustrates the percentage of incarcerated individuals who identify as Black American, highlighting disparities that exist on a national scale. This visualization prompts an important discussion about race, justice, and socioeconomic factors that contribute to these statistics.
Deep Dive into Racial Disparities in Incarceration
The United States has one of the highest incarceration rates in the world, with millions behind bars for various offenses. What's particularly alarming is the racial disparity that persists within this system. According to recent data from the Bureau of Justice Statistics, Black Americans are disproportionately represented in the prison population. In fact, while Black Americans make up approximately 13% of the U.S. population, they account for around 33% of the prison population.
This stark contrast raises many questions: Why is this the case? Several factors contribute to these disparities. Historically, systemic issues such as poverty, lack of access to quality education, and discriminatory practices in law enforcement have disproportionately affected Black communities. These factors not only increase the likelihood of encounters with law enforcement but also influence the judicial outcomes for individuals within these communities.
Interestingly, the war on drugs has played a significant role in the rise of incarceration rates. Policies implemented in the 1980s and 1990s resulted in harsher penalties for drug-related offenses, which predominantly impacted Black Americans. Despite similar rates of drug use across racial lines, Black individuals are arrested and incarcerated at much higher rates than their white counterparts. This systemic bias has lasting effects, perpetuating cycles of poverty and disenfranchisement for communities of color.
Moreover, socioeconomic status plays a crucial role in these dynamics. Black Americans are more likely to live in economically disadvantaged neighborhoods, which can lead to increased interactions with law enforcement. Issues such as unemployment, lack of healthcare, and inadequate housing only exacerbate the situation, creating a perfect storm for higher incarceration rates.
Regional Analysis
When we examine the map more closely, we can see significant regional variations in the percentages of Black American prisoners. For instance, states in the South, such as Louisiana and Mississippi, show alarmingly high percentages of Black American incarceration. Louisiana has one of the highest incarceration rates in the world, with a staggering 55% of its prison population being Black. In contrast, states like Vermont and Maine have much lower percentages, reflecting different social dynamics and criminal justice policies.
Interestingly, urban versus rural settings also display variations in incarceration rates. Urban areas tend to have higher numbers of incarcerated Black Americans, likely due to higher crime rates and increased police presence. In contrast, rural areas may have different community structures and less law enforcement, leading to lower incarceration rates. This discrepancy highlights the importance of context when discussing incarceration and race.
Significance and Impact
The implications of this topic are profound and far-reaching. Understanding the demographics of the prison population is essential for addressing systemic injustices and working toward reform. As conversations around criminal justice reform gain momentum, it is vital to consider the underlying factors contributing to these disparities.
Moreover, the impact of these statistics extends beyond the prison walls. Families and communities are affected when a significant portion of the population is incarcerated, leading to economic instability, emotional distress, and social disintegration. Furthermore, the stigma associated with incarceration can hinder individuals' opportunities for employment and reintegration into society after serving their sentences.
Looking ahead, there are ongoing efforts to reform policies that disproportionately affect Black Americans and other marginalized groups. Initiatives aimed at reducing mandatory minimum sentences for non-violent offenses, improving access to education and employment opportunities, and addressing racial bias within law enforcement are essential steps toward creating a more equitable justice system. The data presented in this map serves as a crucial reminder of the work still needed to achieve true justice and equality in the United States.
Ultimately, the map of the percentage of Black American prisoners in the USA is more than just a graphic representation; it is a call to action for policymakers, communities, and individuals to work towards a fairer system that serves everyone equitably.
Visualization Details
- Published
- September 30, 2025
- Views
- 54
Comments
Loading comments...