Comedy Tour State Inclusion Map

David Chen
Data Visualization Specialist
David Chen is an expert in transforming complex geographic datasets into compelling visual narratives. He combines his background in computer science ...
Geographic Analysis
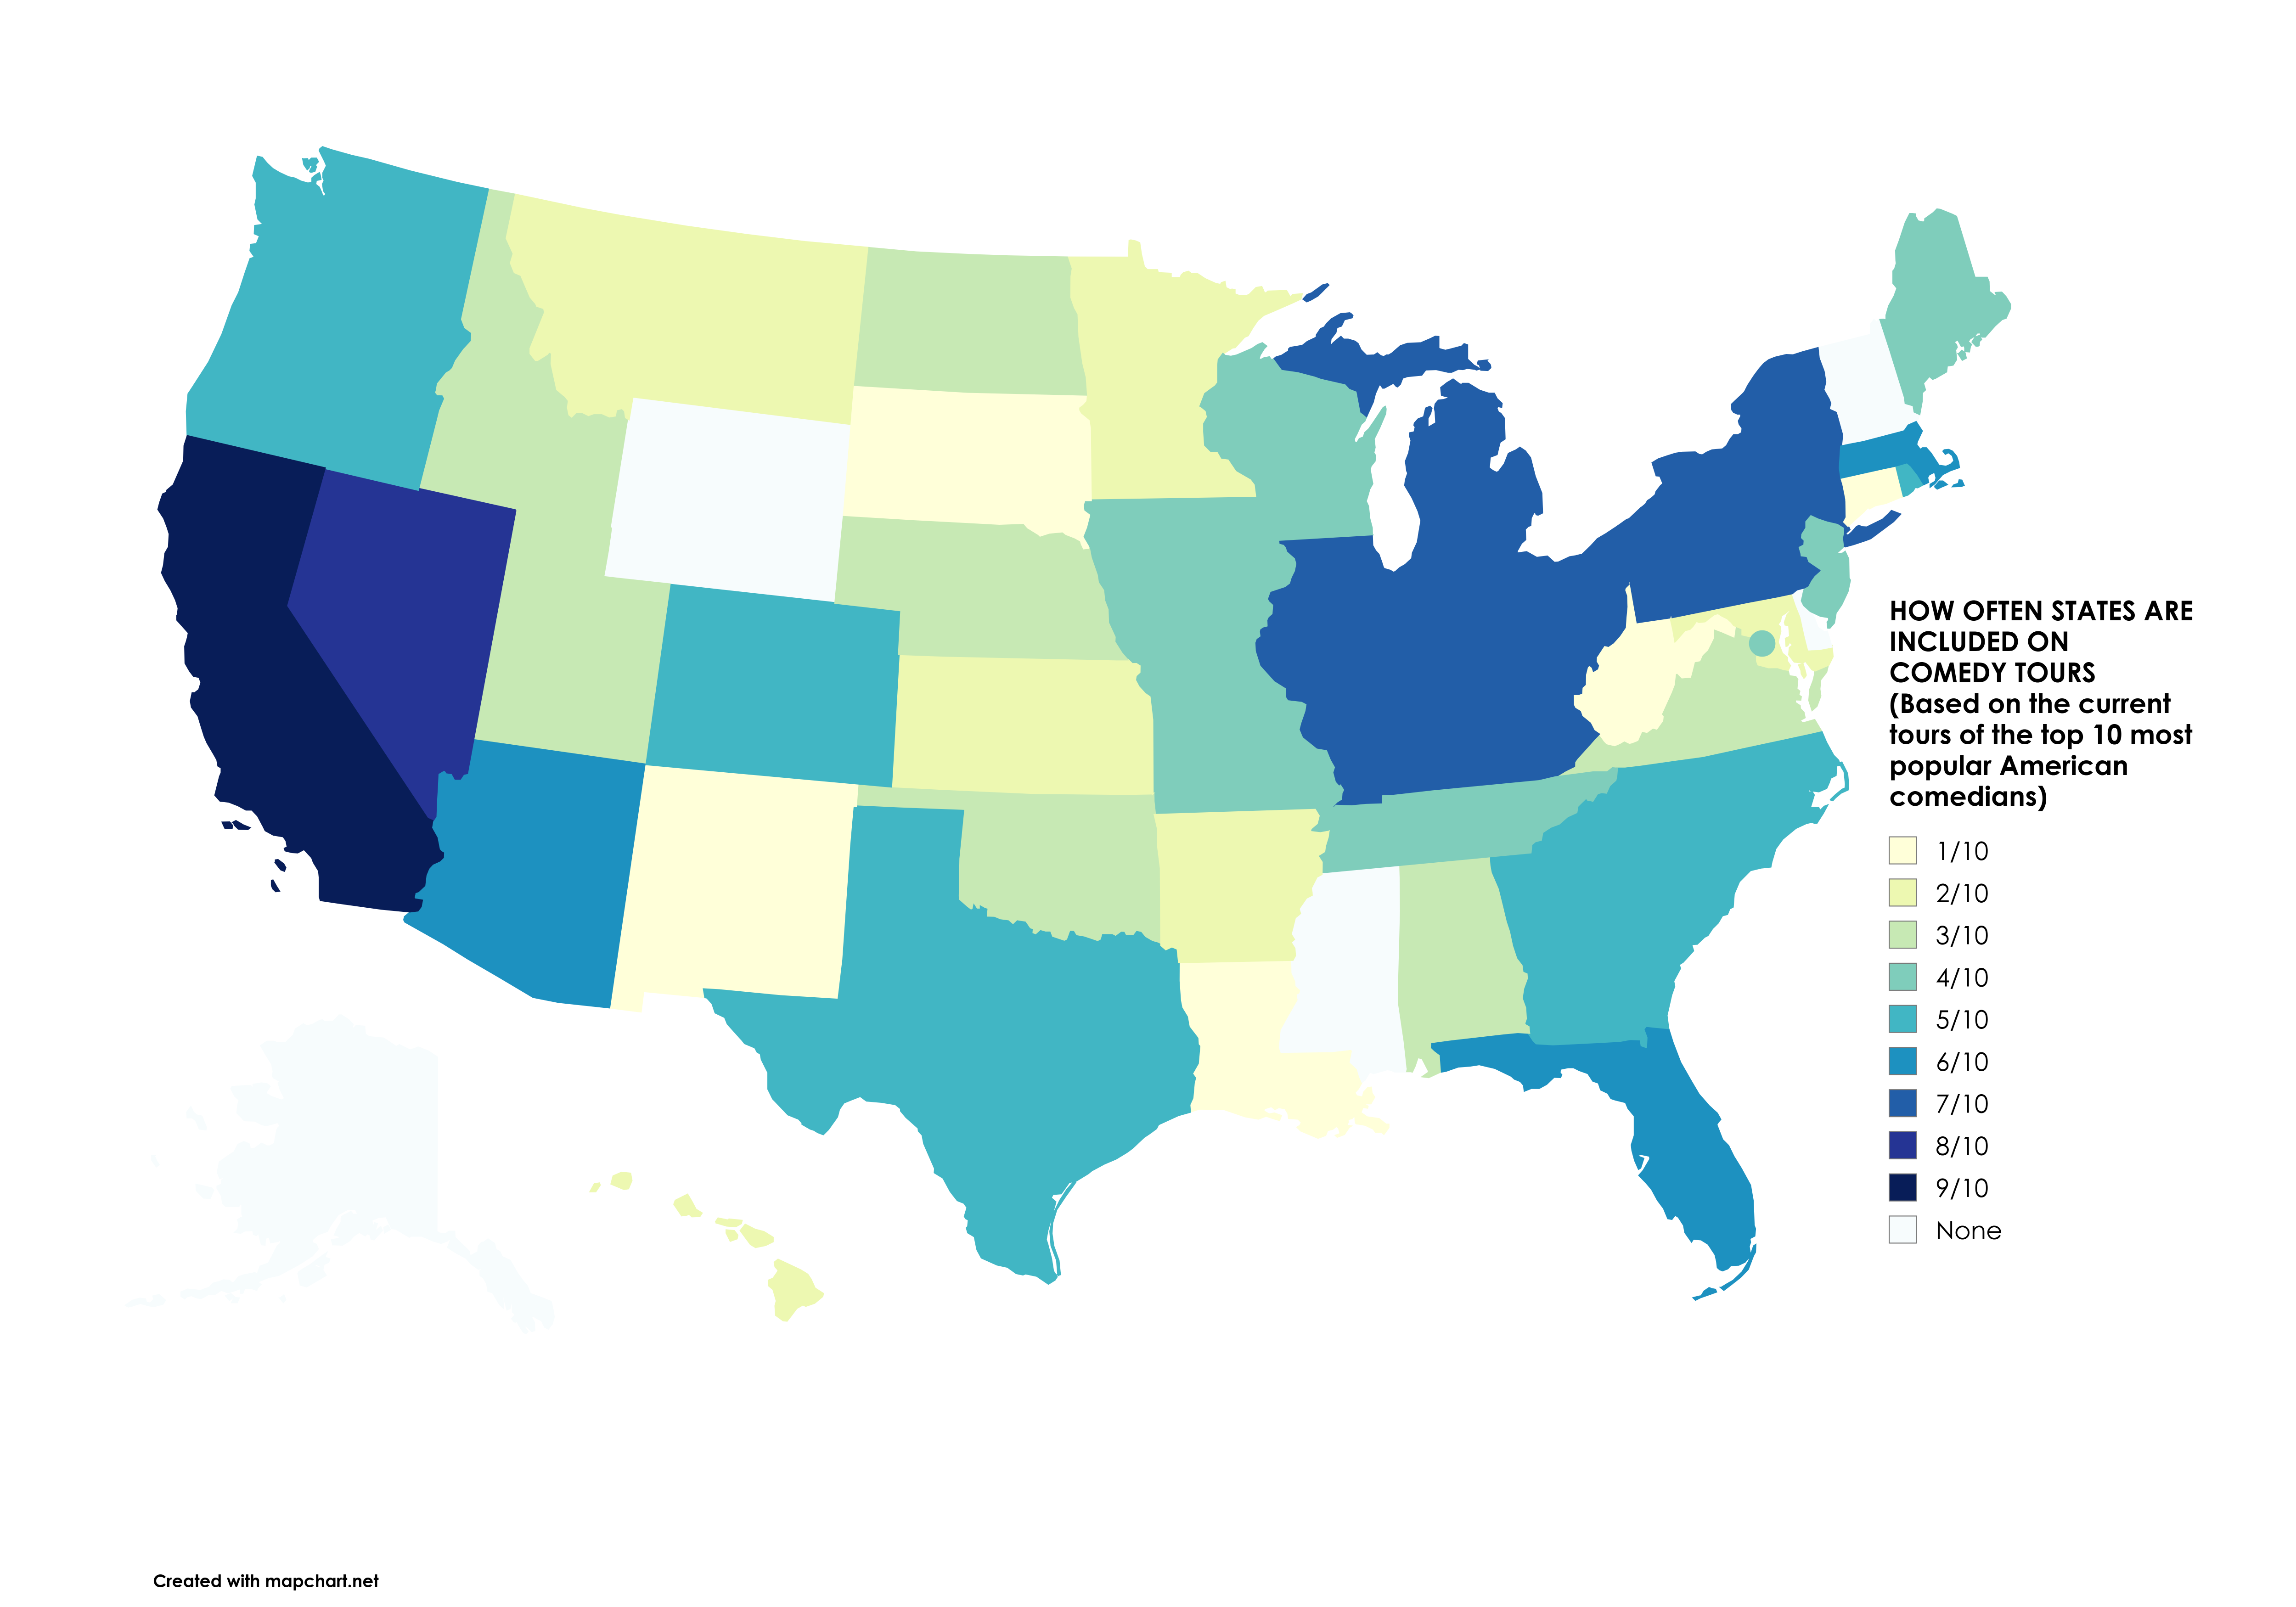
What This Map Shows
This visualization illustrates the frequency with which various states are included in comedy tours by prominent comedians, including Nate Bargatze, Adam Sandler, John Mulaney, Louis C.K., and many others. By analyzing the data, we can discern patterns in comedic performances across the United States, revealing which regions are comedy hotspots and which states may be overlooked by these entertainers. It's a fascinating intersection of geography and entertainment, showing how location influences the comedy scene.
Deep Dive into Comedy Tour Dynamics
Comedy tours are not just about laughter; they reflect a nuanced understanding of audience demographics, cultural hotspots, and entertainment accessibility. Comedians often choose their tour locations based on several factors: population density, regional humor preferences, and even historical retention of comedy culture. For example, states like California and New York frequently appear on tour schedules due to their large urban populations and vibrant entertainment scenes.
Interestingly, the map indicates that states with significant urban centers, such as Illinois with Chicago, are more likely to be included on tours. The concentration of venues and a diverse audience base create an ideal environment for comedians. In contrast, rural areas or states with lower populations, like North Dakota or Wyoming, tend to have fewer comedy shows. This disparity raises questions about accessibility—why do some regions have abundant comedy options while others are left out?
Moreover, the comedic styles and preferences can vary significantly from one region to another. For instance, a comedian known for sharp wit and urban references may find greater success in metropolitan areas rather than in smaller towns where the humor might lean towards different cultural narratives. This regional variation is crucial for comedians when planning their tours.
Another key aspect is the seasonality of comedy tours. Many comedians plan their tours around certain months when they know their audiences are more likely to attend. For instance, summer months might see more outdoor shows in states with favorable weather, while winter could shift focus to indoor venues in colder states. This seasonal strategy not only maximizes attendance but also enhances the overall experience for both the performers and the audience.
Regional Analysis
Analyzing the map, it becomes clear that certain regions dominate the comedy tour landscape. The Northeast, with its dense population centers like New York City and Boston, shows a high frequency of comedy events. This is contrasted by the Midwest, where states like Michigan and Ohio also show strong representation, largely due to cities like Detroit and Columbus, which have established comedy scenes.
On the other hand, the South presents an interesting mix. States like Texas and Florida are comedy hotspots, with major cities like Austin and Miami frequently hosting tours. However, some southern states may not see as much comedic traffic, potentially due to cultural differences in humor and entertainment preferences.
The West Coast, particularly California, is a powerhouse for comedy tours. The map showcases a robust lineup of comedians making stops in Los Angeles and San Francisco. These cities not only have established comedy clubs but also attract comedy festivals that further boost the visibility of comedians.
Interestingly, states with fewer comedy tour dates often have emerging local talent. Comedians from these areas may perform in smaller venues or feature in local festivals, which can be a stepping stone to larger tours in the future. It highlights the dynamic nature of comedy as a continuously evolving art form influenced by geographical factors.
Significance and Impact
Understanding the geographical distribution of comedy tours is significant for several reasons. Firstly, it sheds light on the entertainment landscape and how it adapts to audience preferences across different regions. This map serves as a valuable resource for aspiring comedians and event organizers, allowing them to identify potential markets and strategically plan their performances.
Moreover, the impact of comedy on local economies can be substantial. Comedy shows attract tourists and locals alike, generating revenue for venues, hotels, and restaurants. Regions that embrace comedy as a vital part of their cultural fabric often see broader benefits in terms of tourism and local engagement.
Looking to the future, it's essential to consider how digital platforms are changing the comedy landscape. With the rise of streaming services and virtual performances, comedians may find new ways to engage with audiences across states, regardless of their physical location. This shift could alter traditional tour patterns and provide opportunities for comedians to reach underserved areas, further democratizing access to comedy.
Overall, this map not only highlights where comedians are touring but opens up a broader conversation about the cultural and economic implications of comedy across the United States. As we continue to analyze these trends, we can gain a deeper appreciation for the role of geography in shaping our entertainment experiences.
Visualization Details
- Published
- September 30, 2025
- Views
- 46
Comments
Loading comments...