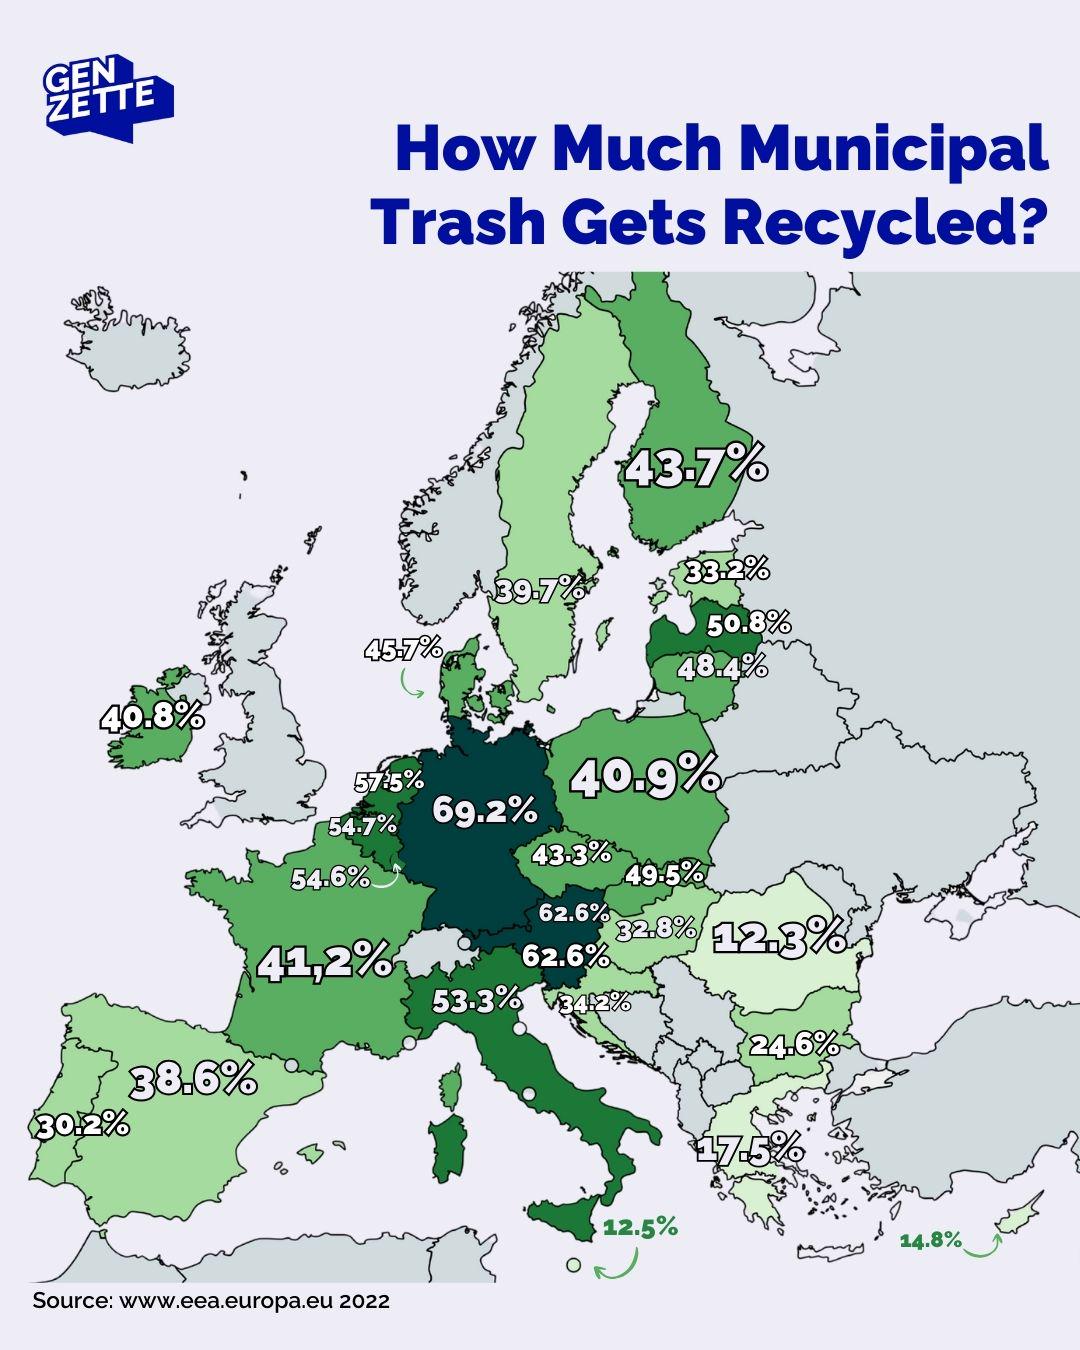
Municipal Waste Recycling Rates Map


David Chen
Data Visualization Specialist
David Chen is an expert in transforming complex geographic datasets into compelling visual narratives. He combines his background in computer science ...
Geographic Analysis
What This Map Shows
The "Municipal Waste Recycling Rates Map" provides a visual representation of how much municipal waste is being recycled across different regions. It highlights the diverse recycling rates and practices that vary significantly from one area to another. As waste management becomes a pressing issue globally, understanding recycling patterns is crucial for sustainable urban development.
Deep Dive into Municipal Waste Recycling
Recycling is an integral part of waste management, aimed at minimizing landfill use and promoting sustainability. Municipal waste refers to the waste generated by households and businesses, and it encompasses various materials, including paper, plastics, metals, and organic waste. Interestingly, the effectiveness of recycling programs can significantly influence the overall waste management strategy of a municipality.
In many regions, the recycling rate is a critical indicator of environmental health. For instance, in 2021, the average recycling rate in the United States was about 35%, but this figure varies widely by state. Some states like Vermont and Maine have achieved rates exceeding 50%, thanks to robust policies and community engagement. Conversely, states with less stringent regulations and public awareness may report rates as low as 10%.
The materials commonly recycled include: - **Paper and Cardboard**: These are the most recycled materials globally, with a recycling rate of about 66% in the U.S. However, contamination from food waste or other materials can hinder recycling efforts. - **Plastics**: Only about 9% of plastic waste is effectively recycled. This low rate is due to the complexities of sorting and processing different types of plastics, as well as the economic feasibility of recycling compared to producing new plastic. - **Metals**: Aluminum cans are one of the most recycled materials, with a rate of around 50%. Recycling metals saves significant energy and resources compared to extracting raw materials. - **Organic Waste**: Composting organic waste is becoming increasingly popular, with some municipalities implementing programs that allow residents to recycle food scraps and yard waste.
Understanding these materials and their recycling rates provides insight into how communities can improve their waste management practices. Moreover, the effectiveness of recycling programs can be influenced by several factors, including public education, convenience of recycling services, and local policies.
Regional Analysis
The map illustrates significant disparities in recycling rates across different regions. For example, urban areas often demonstrate higher recycling rates compared to rural areas due to better access to recycling facilities and more robust waste management programs. In cities like San Francisco, ambitious goals have led to a recycling rate of over 80%, largely due to comprehensive policy frameworks and community involvement.
In contrast, some regions in the Midwest and South lag behind, with rates below the national average. This can often be attributed to a lack of infrastructure, limited public awareness campaigns, or insufficient state regulations encouraging recycling. For example, states like Alabama and Mississippi report recycling rates below 15%, indicating a need for improved waste management strategies.
Interestingly, international comparisons reveal that countries like Germany and Sweden consistently lead in recycling efforts, achieving rates upwards of 60%. These countries have implemented policies encouraging not only recycling but also reducing waste generation at the source. Understanding why certain regions excel while others struggle can inform future waste management policies and public initiatives across the globe.
Significance and Impact
The topic of municipal waste recycling is not just about numbers; it has profound implications for environmental sustainability and public health. With landfills reaching capacity in many areas, an increased focus on recycling can alleviate pressure on these sites and contribute to a circular economy. This approach not only conserves resources but also reduces greenhouse gas emissions associated with waste disposal.
Furthermore, as global awareness of climate change intensifies, communities are recognizing that effective waste management is crucial for reducing their carbon footprints. Policymakers are increasingly motivated to implement comprehensive recycling programs that engage citizens and foster a culture of sustainability.
Looking ahead, trends indicate a growing emphasis on technology in recycling processes, such as sorting robots and blockchain for tracking materials. This evolution promises to streamline recycling efforts and make them more efficient. Have you noticed how many more recycling bins are popping up in your neighborhood? This could be a reflection of a broader societal shift towards responsible waste management practices.
In conclusion, understanding municipal waste recycling rates is essential for shaping effective waste management strategies. The disparities highlighted in the map serve as a reminder of the work that still needs to be done to promote sustainability and environmental stewardship across regions. As individuals and communities, we must strive to improve our recycling habits, advocate for better policies, and educate ourselves and others about the importance of recycling for a healthier planet.
Visualization Details
- Published
- September 27, 2025
- Views
- 40
Comments
Loading comments...