Estimated LGBT Population by U.S. State Map

David Chen
Data Visualization Specialist
David Chen is an expert in transforming complex geographic datasets into compelling visual narratives. He combines his background in computer science ...
Geographic Analysis
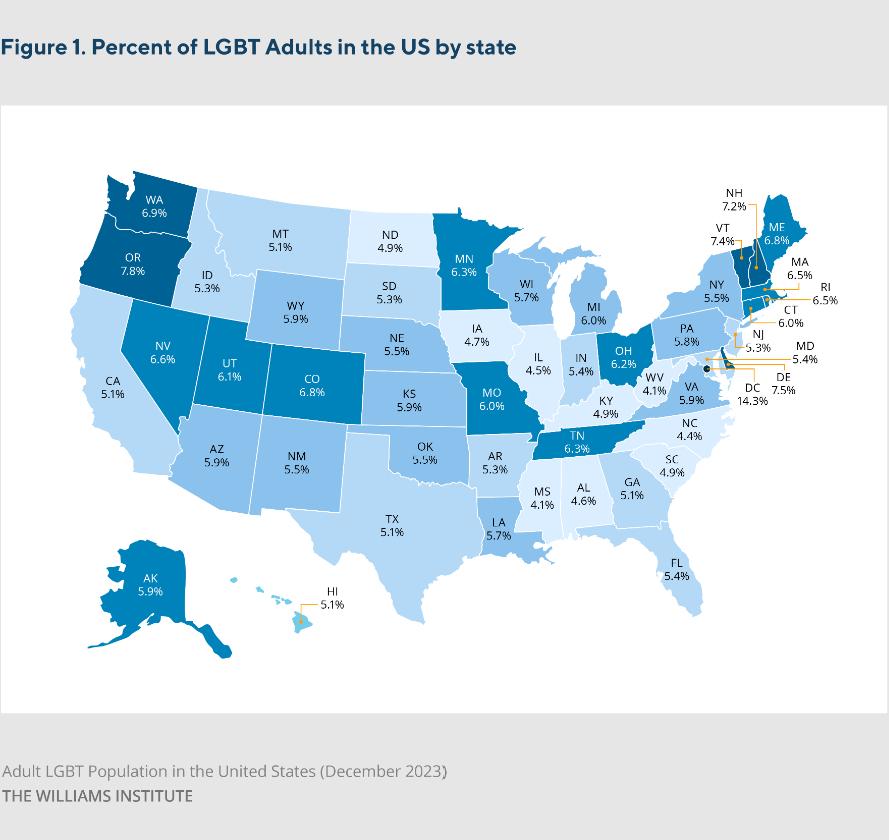
What This Map Shows
The Estimated LGBT Population by U.S. State Map, developed by the Williams Institute, provides a visual representation of the estimated percentage of the LGBT community within each state across the United States. This map highlights not only the distribution of LGBT individuals but also serves as a critical tool for understanding the demographic landscape of sexual minorities in America. The data presented here draws from extensive research and surveys, shedding light on a community that has historically faced marginalization and underrepresentation.
Deep Dive into LGBT Demographics
The LGBT population encompasses a diverse set of identities, including lesbian, gay, bisexual, transgender, and queer individuals. Understanding the demographics of this community is crucial for a variety of reasons, including policy-making, healthcare access, and social services. Interestingly, studies estimate that around 4.5% of adults in the U.S. identify as LGBT, but this figure can vary significantly by region.
Demographics reveal patterns influenced by social, cultural, and legal factors. For instance, states like California and New York boast larger LGBT populations, which can be attributed to their urban environments and more progressive social attitudes. In contrast, conservative areas often report lower percentages, reflecting the challenges faced by LGBT individuals in those communities.
The map indicates that metropolitan areas like San Francisco and New York City have particularly high concentrations of LGBT individuals, where social acceptance and community resources are more prevalent. In cities with vibrant LGBT scenes, such as Chicago and Atlanta, the visibility and support for the community contribute to higher self-identification rates.
Moreover, socioeconomic factors also play a significant role in shaping these demographics. Areas with greater economic opportunities often attract more diverse populations, including LGBT individuals seeking acceptance and a better quality of life. Conversely, in rural areas where traditional values dominate, stigma and discrimination can lead to underreporting among LGBT residents, making accurate estimations challenging.
Regional Analysis
Examining the map reveals distinct regional trends. The West Coast, particularly California, demonstrates a higher estimated LGBT population, with cities like Los Angeles and San Francisco leading the way. For instance, San Francisco is known for its rich LGBT history, vibrant Pride celebrations, and supportive policies, contributing to an estimated 15% of its population identifying as LGBT.
In the Northeast, states such as New York and Massachusetts also show significant populations, with Massachusetts being one of the first states to legalize same-sex marriage in 2004. This progressive stance has fostered an environment where LGBT individuals feel more comfortable coming out. Interestingly, the Southern states present a mixed picture; while urban centers like Atlanta and New Orleans have thriving LGBT communities, rural areas may have markedly lower percentages due to cultural and religious conservatism.
In the Midwest, states like Illinois and Minnesota reflect a growing acceptance, with Chicago hosting one of the largest Pride events in the nation. However, states like Indiana and Ohio showcase more conservative attitudes, resulting in lower estimated LGBT populations. The disparities among these regions emphasize the importance of local culture and politics in shaping the experiences of LGBT individuals.
Significance and Impact
The map's significance extends beyond mere statistics; it sheds light on the social dynamics that affect the lives of LGBT individuals. Understanding where these populations are concentrated can drive policies that promote equality and inclusion. For example, knowing that states with higher LGBT populations often also have better healthcare access and anti-discrimination laws underscores the need for continued advocacy.
Current trends indicate that acceptance of the LGBT community is increasing, yet challenges remain. Issues such as healthcare disparities, violence against LGBT individuals, and legal battles over rights still plague many states, particularly those with lower estimated LGBT populations. As society evolves, future projections suggest that the visibility of LGBT individuals will continue to rise, potentially leading to even greater acceptance and the establishment of protective laws.
Ultimately, the Estimated LGBT Population by U.S. State Map serves as a crucial tool for understanding the demographic landscape of the LGBT community in America. It emphasizes the necessity for continued support, advocacy, and policy reform to ensure that all individuals, regardless of their sexual orientation, can thrive in an inclusive and accepting society.
Visualization Details
- Published
- September 16, 2025
- Views
- 60
Comments
Loading comments...