UFO Sightings Map per 10,000 People

Marcus Rodriguez
Historical Geography Expert
Marcus Rodriguez specializes in historical cartography and geographic data analysis. With a background in both history and geography, he brings unique...
Geographic Analysis
What This Map Shows
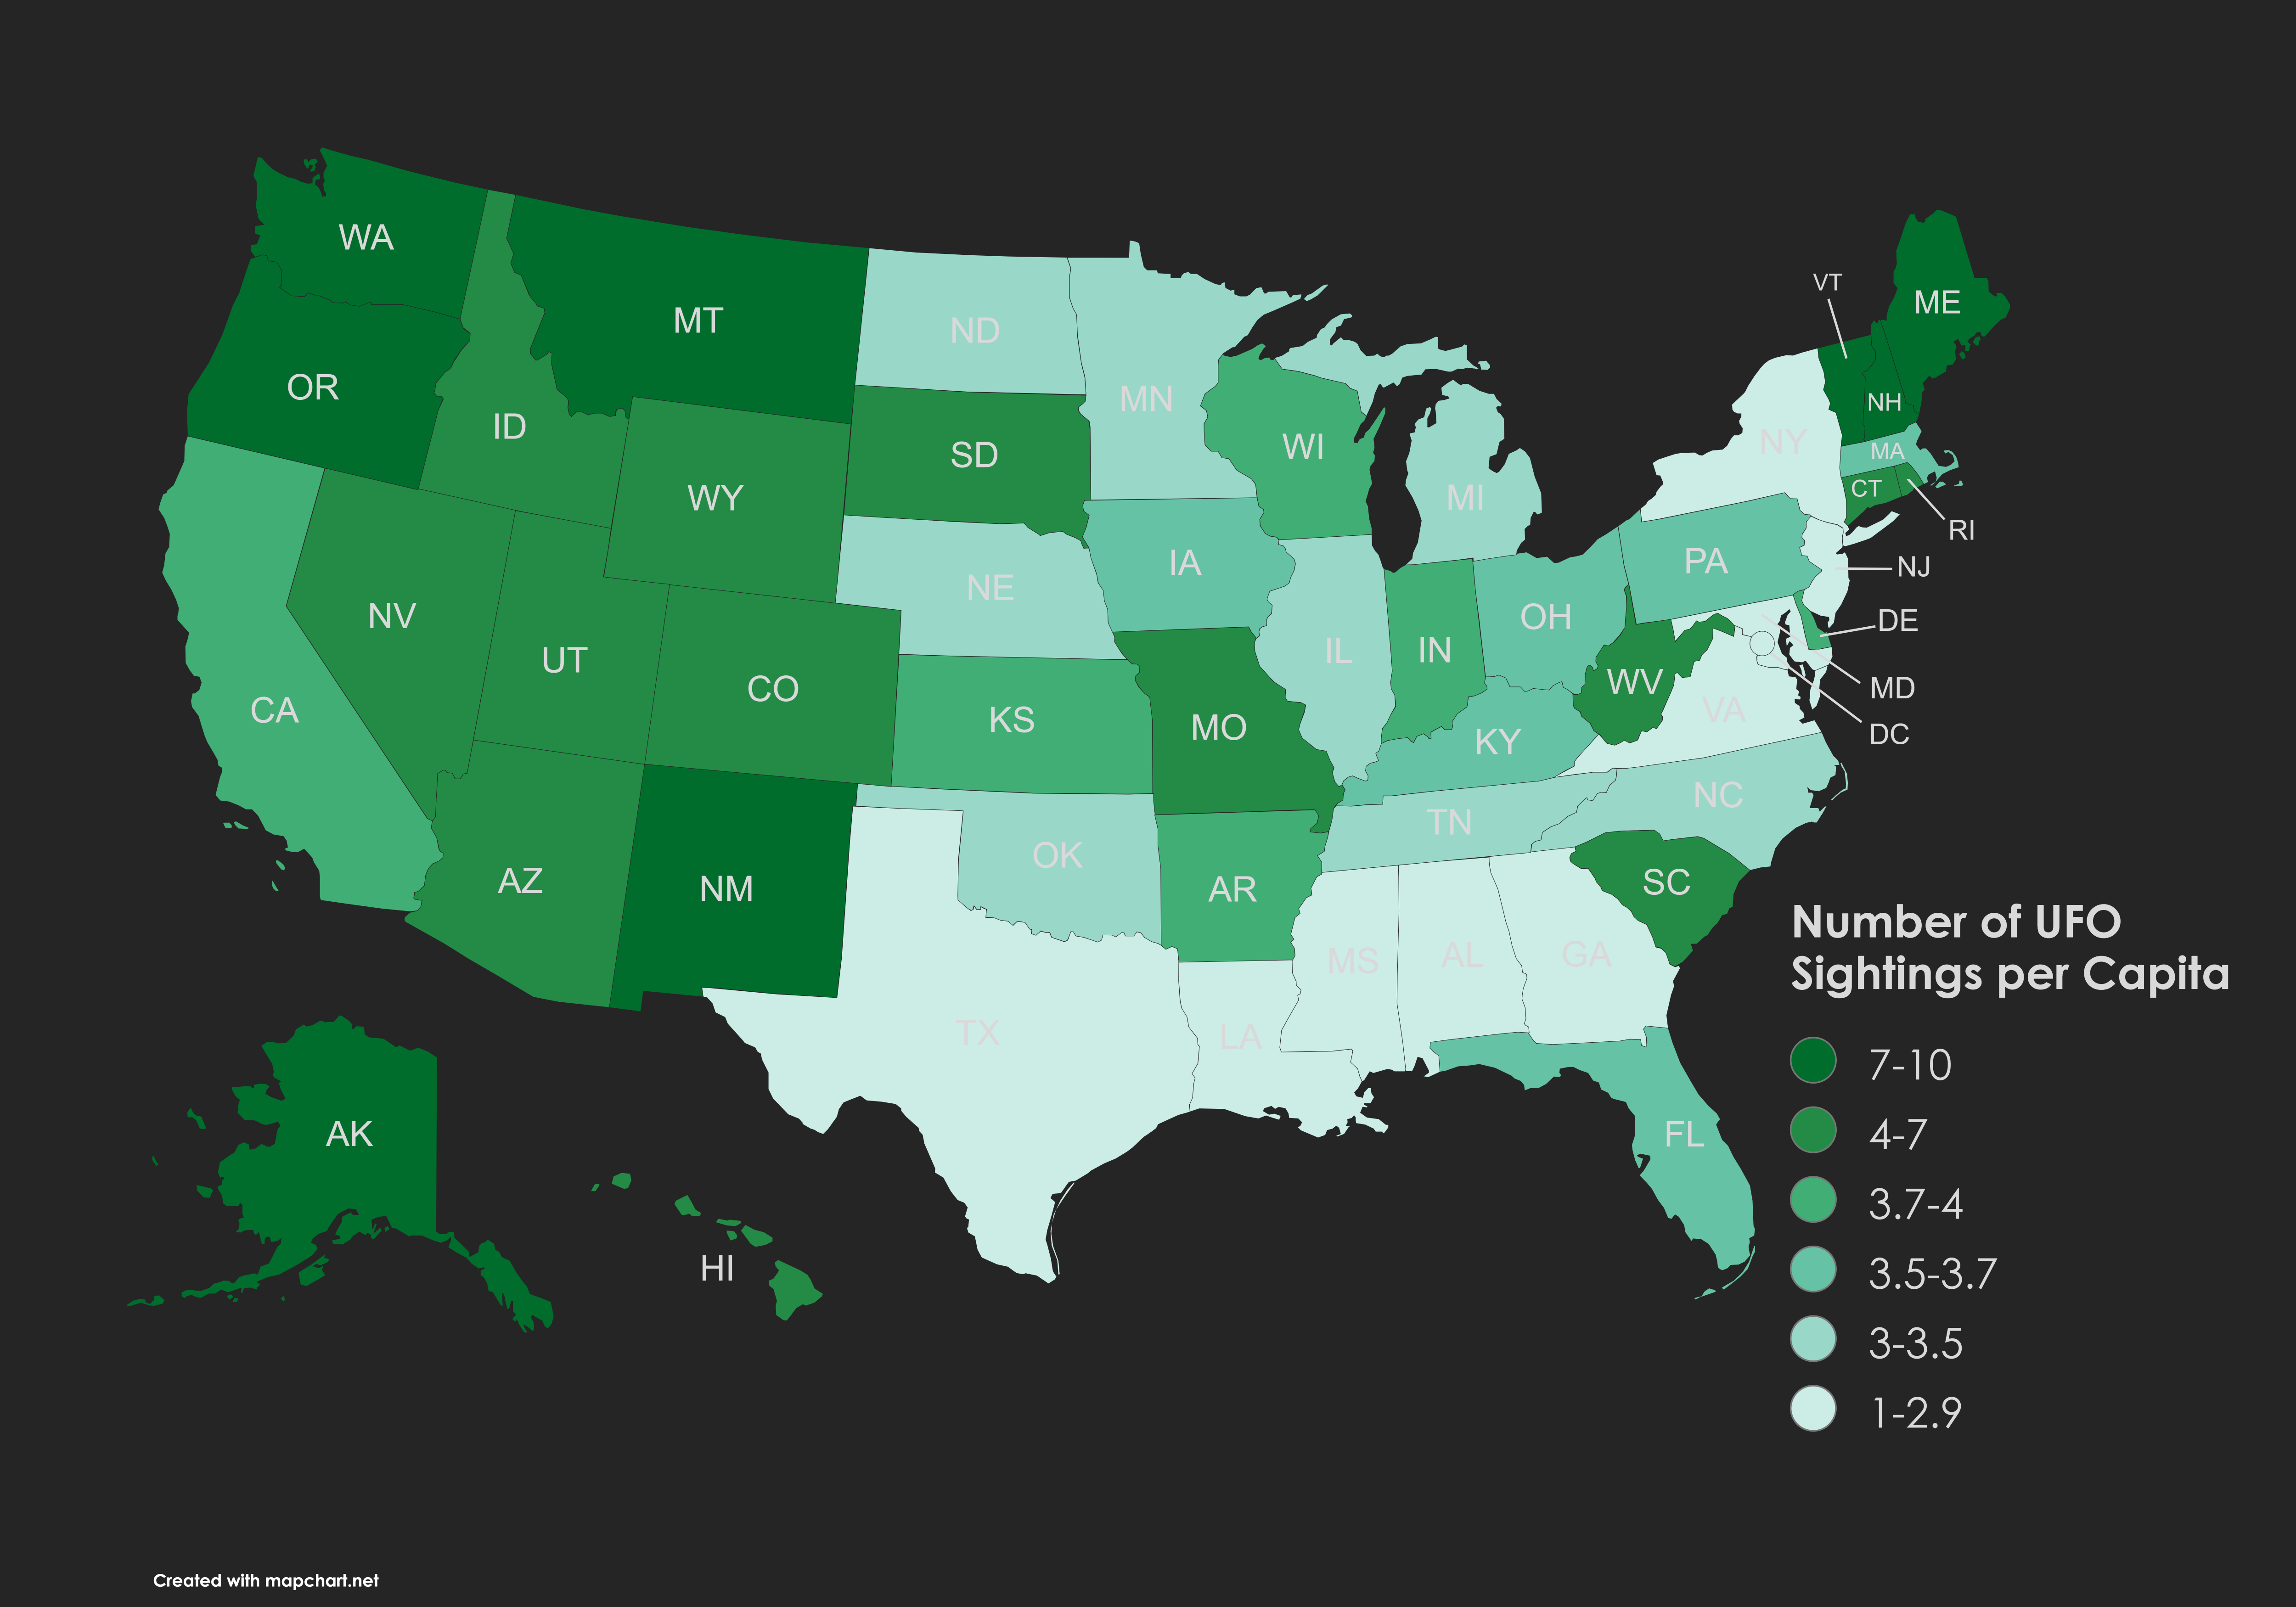
The visualization titled "UFO Sightings per 10,000 People" based on data from the National UFO Reporting Center provides a fascinating glimpse into the frequency of reported unidentified flying object sightings across the United States. This map doesn’t just illustrate where UFOs are spotted; it highlights the prevalence of these sightings in relation to population density, allowing us to see which areas experience more reports per capita. As we delve into the subject, we’ll explore the cultural, social, and geographical factors that might contribute to these sightings.
Deep Dive into UFO Sightings
UFO sightings have long captivated the public imagination, blending elements of science fiction with real-world phenomena. The term "UFO" itself refers to any aerial phenomenon that cannot be immediately identified. This includes everything from weather balloons to experimental military aircraft, and even perhaps, as some enthusiasts believe, extraterrestrial spacecraft. Interestingly, the phenomenon of UFO sightings is not new; reports date back centuries, with many cultures documenting strange lights and objects in the sky.
In the modern era, the rise of the internet and social media has led to a surge in reported sightings. The National UFO Reporting Center (NUFORC) has compiled a vast database of these reports, allowing researchers and enthusiasts alike to analyze patterns and trends. The map in question provides context by normalizing sightings against population figures, giving a clearer picture of where sightings are most concentrated.
What’s fascinating is that certain regions of the United States tend to report UFO sightings more frequently than others, and this can often be linked to various factors. For instance, areas with larger populations like California and Texas not only have more people to witness these events but also more cultural openness to discussing them. Additionally, certain geographical features may play a role. Regions with open skies, such as the deserts of Nevada, may provide better visibility for potential sightings compared to densely populated urban areas.
Moreover, the psychological aspect cannot be overlooked. The belief in UFOs is often influenced by local culture, media representation, and even historical events. For example, the infamous Roswell incident in 1947 has cemented New Mexico's status as a hotspot for UFO enthusiasts and has likely contributed to the higher number of reported sightings in that area.
Regional Analysis
When examining the map closely, we can see that states like California, Florida, and Texas stand out with high rates of reported UFO sightings per 10,000 people. California, for instance, has a long history of UFO reports, with the famous 1966 sightings in the San Fernando Valley leading to increased public interest and subsequent reports. In contrast, states with fewer sightings, such as North Dakota or South Dakota, may reflect both lower population densities and less cultural emphasis on UFO phenomena.
Interestingly, the map also shows clusters of sightings in regions like the Pacific Northwest and the Southwestern United States. The Pacific Northwest, with its vast wilderness and folklore surrounding mysterious creatures, seems to foster a culture of reporting unusual occurrences. On the other hand, the Southwest, particularly around Nevada, is often associated with military testing and is home to Area 51, further fueling public interest and sightings.
Significance and Impact
Understanding UFO sightings and their geographic distribution matters more than just satisfying curiosity; it connects to broader themes of societal beliefs, the search for extraterrestrial life, and even the impact of technology on our perception of the unknown. In recent years, there has been a shift in how UFOs are regarded, especially with the U.S. government releasing previously classified reports. This shift could lead to increased public interest and more reports as people feel more comfortable discussing their experiences.
Moreover, the implications of UFO sightings extend into areas of environmental awareness and cultural identity. Regions that report higher sightings may also experience a rise in tourism related to UFO culture, impacting local economies. As awareness grows, the conversation around UFOs may evolve from mere speculation to serious scientific inquiry, encouraging collaboration between researchers, enthusiasts, and the government.
In conclusion, this map not only provides a statistical look at UFO sightings across the U.S. but also opens the door to deeper discussions about human perception, culture, and the mysteries of our universe. The interplay between geography, population, and cultural factors creates a rich tapestry that invites ongoing exploration.
Visualization Details
- Published
- September 15, 2025
- Views
- 84
Comments
Loading comments...