Map of Americans on Social Security by State

Alex Cartwright
Senior Cartographer & GIS Specialist
Alex Cartwright is a renowned cartographer and geographic information systems specialist with over 15 years of experience in spatial analysis and data...
Geographic Analysis
What This Map Shows
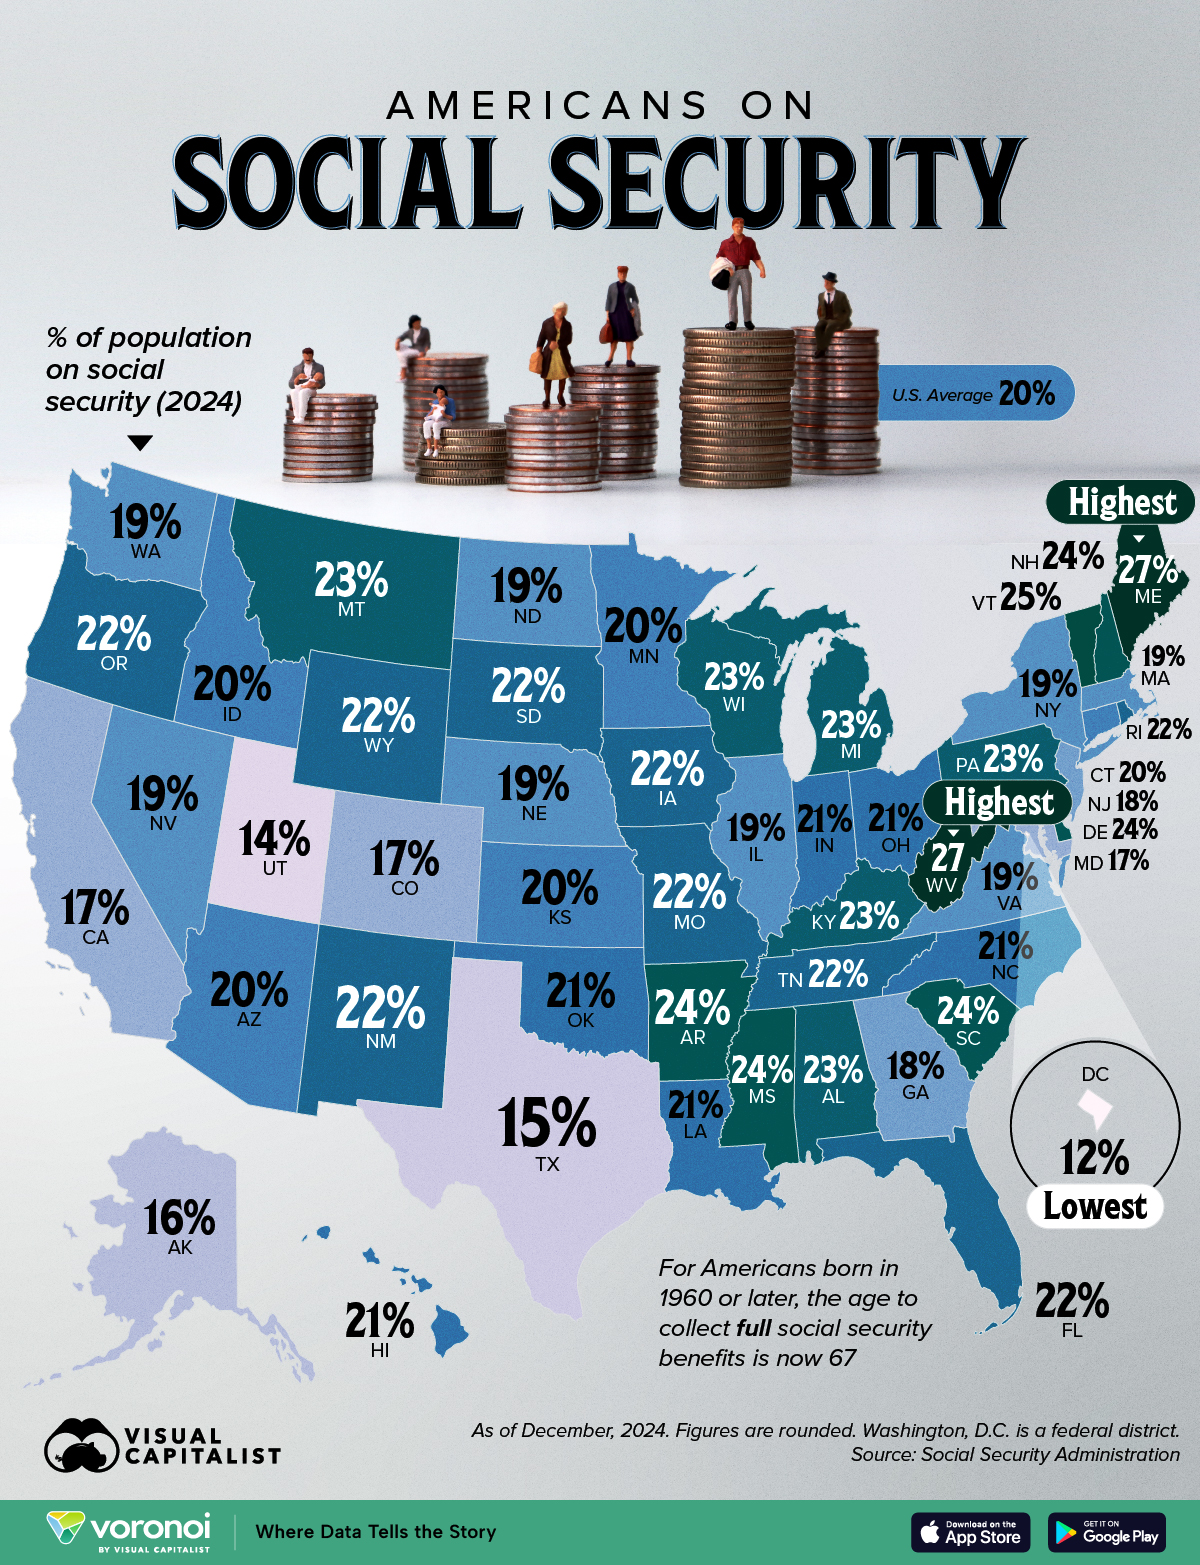
The "Map of Americans on Social Security by State" provides a visual representation of the percentage of the population in each state that relies on Social Security benefits. This important visualization highlights how various demographic factors, economic conditions, and state policies affect the distribution of Social Security recipients across the United States. The map serves as a powerful tool to understand the socio-economic landscape of the nation, revealing insights into the lives of millions who depend on this crucial financial support.
Deep Dive into Social Security in America
Social Security is a government program that provides financial assistance to individuals who are retired, disabled, or survivors of deceased workers. It plays a vital role in alleviating poverty among the elderly and disabled populations. As of 2023, approximately 66 million Americans receive Social Security benefits, amounting to about one in every six residents of the country. This program has become a cornerstone of financial security for many, especially as life expectancy rises and traditional pensions decline.
The distribution of Social Security recipients varies significantly from state to state for several reasons. Factors such as age demographics, employment opportunities, and cost of living all contribute to the percentage of individuals relying on Social Security. For instance, states with higher populations of older adults, like Florida and Maine, typically show a higher percentage of residents receiving Social Security benefits. In contrast, states with younger populations, such as Utah and Texas, tend to have lower percentages.
Interestingly, the dependency on Social Security isn't just about age; it's also closely linked to economic conditions. States with robust job markets and low unemployment rates often see a smaller proportion of their populations on Social Security. Conversely, in states experiencing economic challenges, such as West Virginia and Mississippi, the reliance on Social Security can be significantly higher.
Recent data indicates that the average monthly Social Security benefit is around $1,500, which is crucial for many individuals and families to cover basic living expenses, including housing, healthcare, and food. However, this amount often falls short of meeting all needs, leading to discussions about the adequacy of Social Security in today’s economy. As the program faces financial challenges, such as potential shortfalls in the Social Security Trust Fund, the future stability of these benefits becomes an important topic of discussion among policymakers and citizens alike.
Regional Analysis
Examining the map reveals distinct regional patterns in Social Security dependency. In the Northeast, states like New York and Pennsylvania show considerable percentages of residents receiving Social Security, reflective of their older populations and economic conditions. For instance, Pennsylvania has a significant number of retirees due to its historical industrial economy, which has transitioned to a service-oriented workforce.
The Southern states often have a mixed picture. For example, Florida, known for its large retiree population, has one of the highest percentages of Social Security recipients in the nation. This trend can be attributed to its warm climate and attractive retirement options. In contrast, states like Alabama and Arkansas, while having substantial populations on Social Security, also grapple with economic challenges that lead to higher levels of poverty among the elderly.
On the West Coast, states like California show surprising data. Despite its large population, the percentage of residents on Social Security is lower than expected, partly due to a younger demographic and a thriving economy. However, in more rural areas of California, the dependency on Social Security can be higher, influenced by factors such as the cost of living and access to employment opportunities.
Significance and Impact
Understanding the distribution of Social Security recipients is crucial for several reasons. First, it sheds light on the economic health and demographic shifts within states, helping policymakers address the needs of vulnerable populations. As the Baby Boomer generation continues to retire, the implications of Social Security on state budgets and healthcare systems will be profound.
Moreover, this map can inform discussions about the future of Social Security itself. With rising costs and changing workforce dynamics, there is a pressing need to evaluate how benefits are structured and funded. The reliance on Social Security varies by state and can serve as a call to action for states to develop more comprehensive support systems for their aging populations.
In conclusion, the "Map of Americans on Social Security by State" not only highlights the importance of this program in the lives of many individuals but also serves as a reminder of the socio-economic factors that shape our society. As we look to the future, it is essential to consider how we can ensure that Social Security remains a reliable foundation for those who depend on it most.
Visualization Details
- Published
- September 15, 2025
- Views
- 68
Comments
Loading comments...