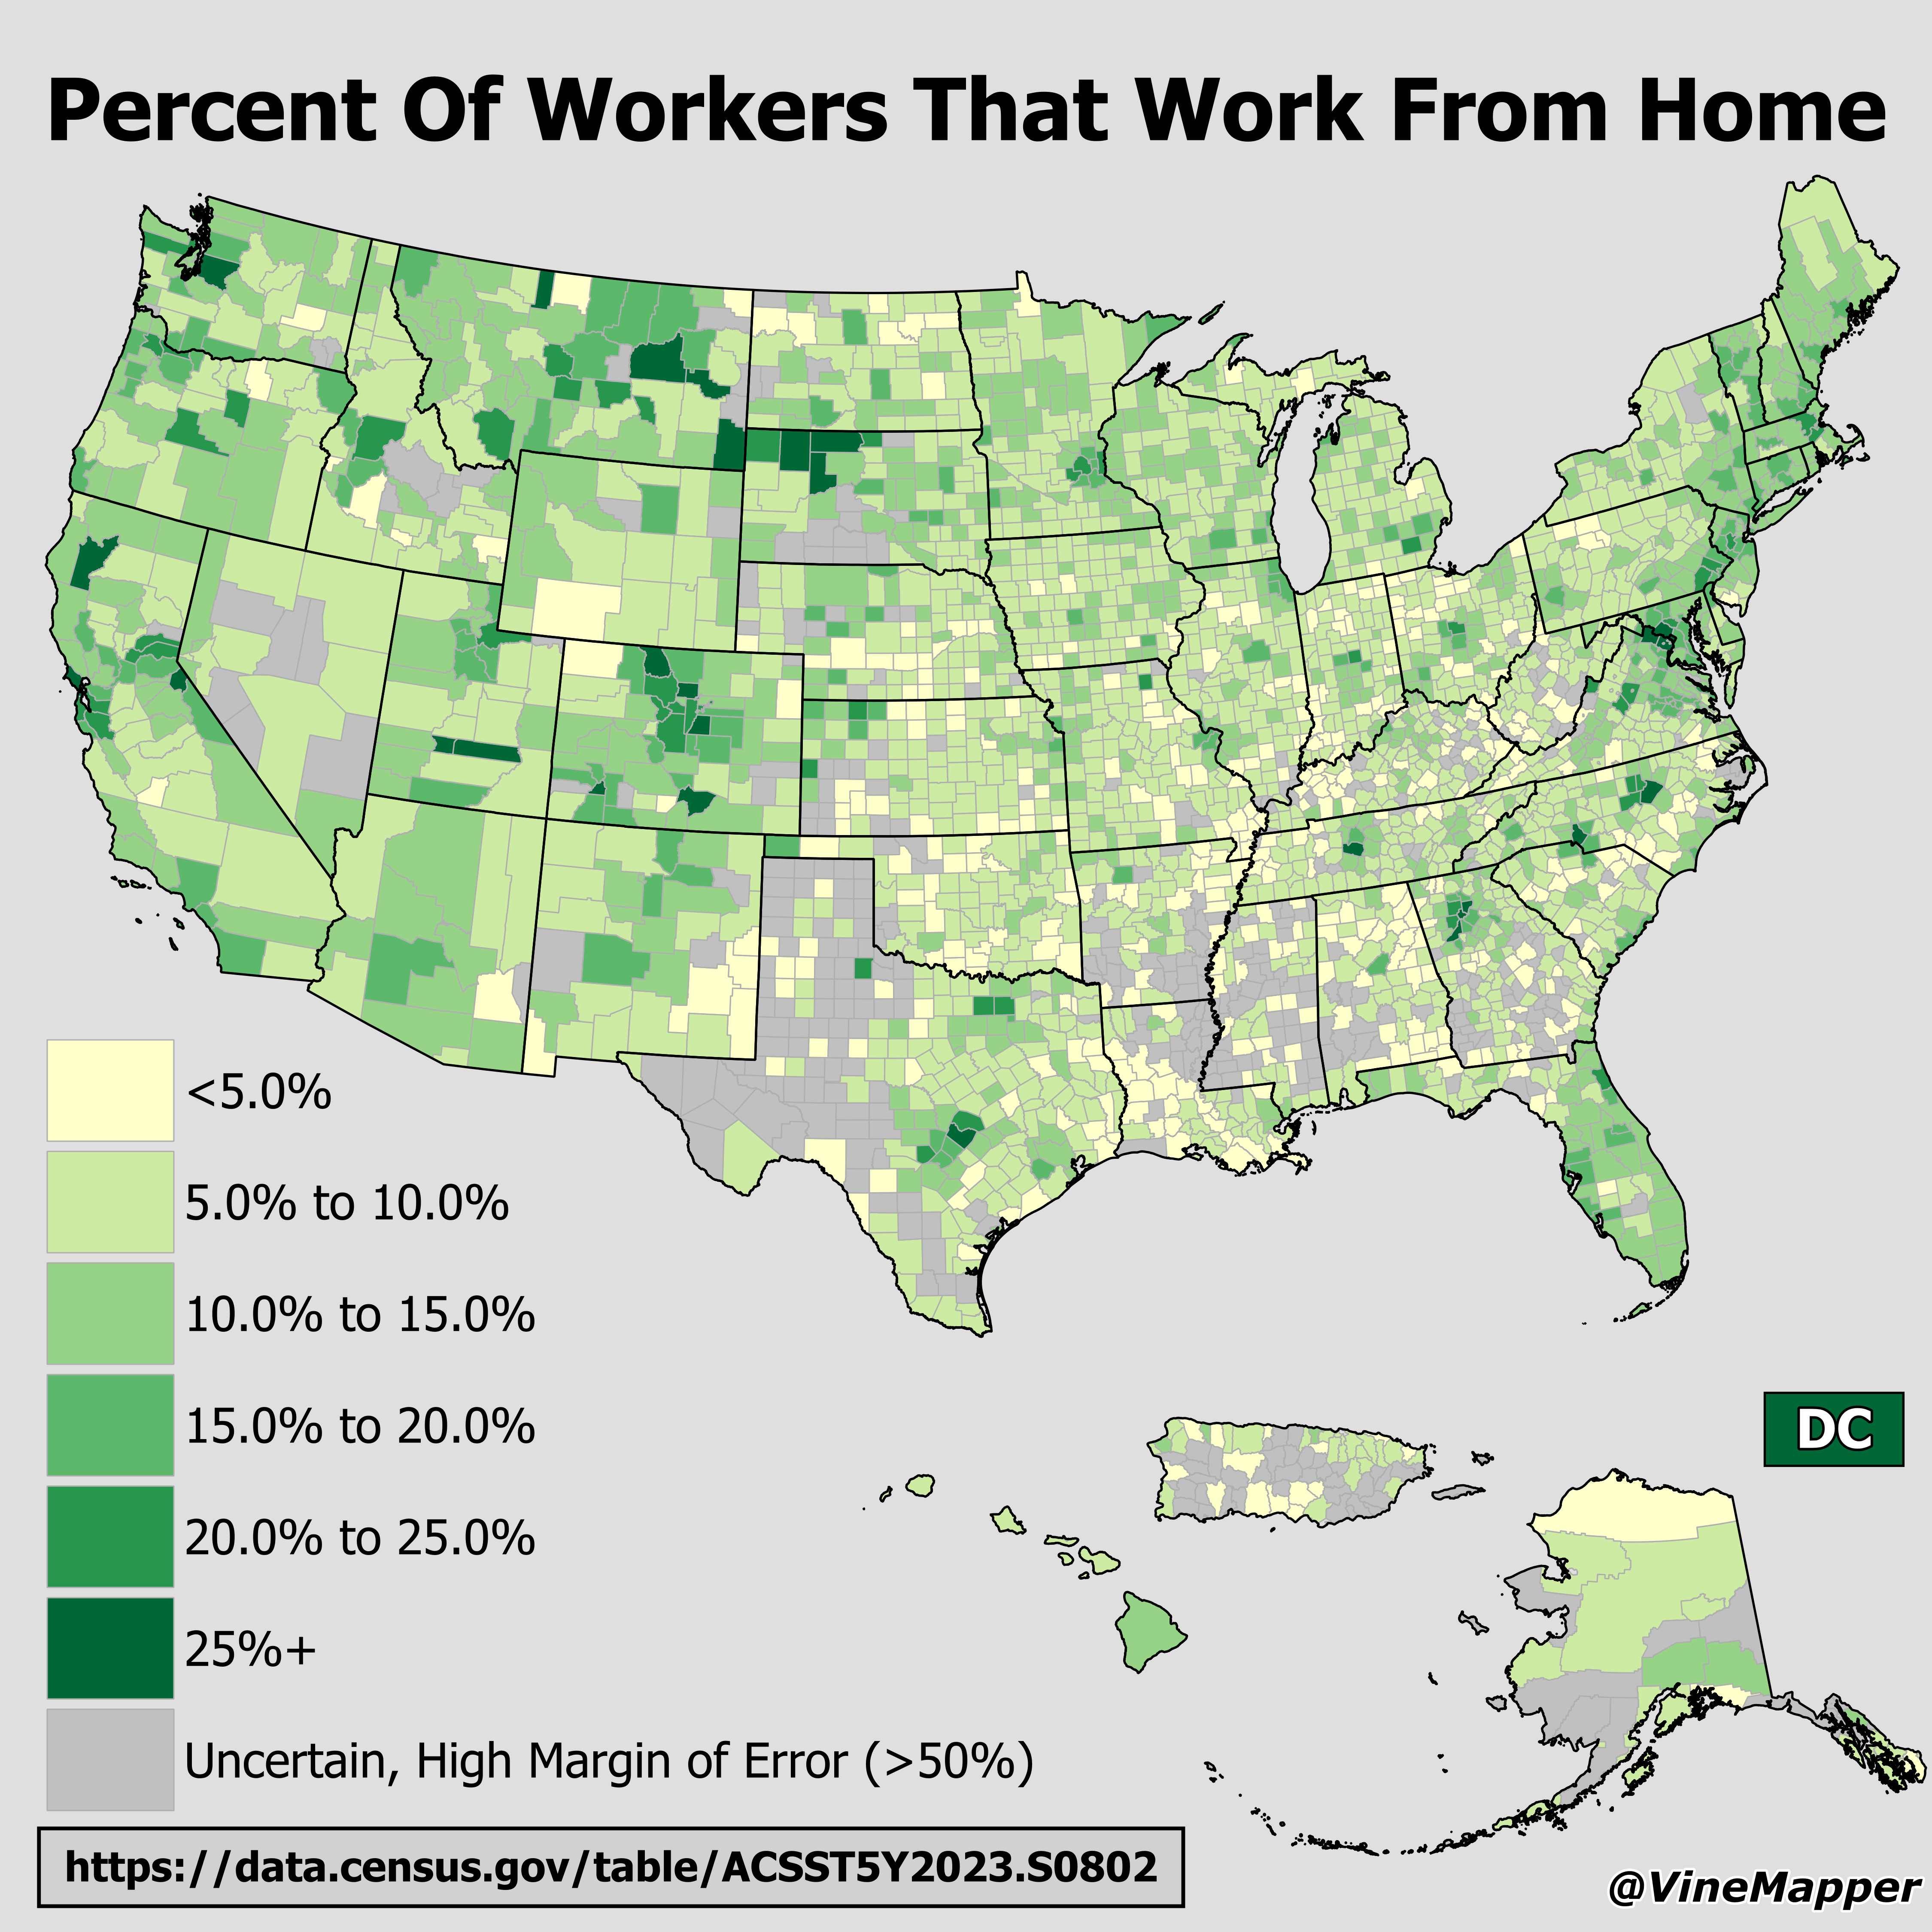
Map of Percent of Workers That Work From Home Per County

Marcus Rodriguez
Historical Geography Expert
Marcus Rodriguez specializes in historical cartography and geographic data analysis. With a background in both history and geography, he brings unique...
Geographic Analysis
What This Map Shows
This map provides a compelling visualization of the percentage of workers who are working from home across various counties in the United States. It highlights the stark differences in remote work adoption, reflecting not only the changing dynamics of the workforce but also the socio-economic factors that influence these trends. As more organizations embrace flexible work arrangements, understanding where remote work is most prevalent can shed light on regional economic health, infrastructure needs, and community resilience.
Deep Dive into Remote Work Trends
The rise of remote work has reshaped the landscape of employment in recent years, particularly accelerated by the COVID-19 pandemic. According to reports from the U.S. Bureau of Labor Statistics, prior to the pandemic, around 24% of employees were working from home at least part-time. However, during the height of the crisis, that number skyrocketed to nearly 50% of all employed individuals. But what does this all mean in a geographical context? Interestingly, the propensity for remote work varies significantly by industry, education level, and, most importantly, geography. For instance, urban areas with robust tech industries, such as Silicon Valley and New York City, have higher rates of remote work due to the nature of the jobs, which often lend themselves to telecommuting. Conversely, rural areas or regions with economies reliant on sectors like manufacturing or agriculture tend to have lower percentages of workers who can work from home. Moreover, factors such as internet accessibility, housing density, and local policies play crucial roles in shaping these statistics. For example, counties with high-speed internet access and a younger demographic may show higher percentages of remote workers. In contrast, areas lacking infrastructure may see fewer opportunities for workers to telecommute. Current data shows that metropolitan counties often lead the way in remote work adoption. For instance, counties in Washington D.C. or the San Francisco Bay Area often report over 40% of their workforce operating remotely, while some rural counties may report figures as low as 10%. This disparity highlights the digital divide that is prevalent in the U.S.
Regional Analysis
When examining the map more closely, we can observe distinct regional patterns. For example, counties in the Northeast, particularly in New York and Massachusetts, tend to have higher percentages of remote workers. These areas are characterized by a concentration of jobs in finance, technology, and professional services, all of which have adapted to remote work environments swiftly. On the flip side, Southern states like Alabama and Mississippi report significantly lower percentages of remote work. This can be attributed to a workforce that includes a larger proportion of jobs in manufacturing and healthcare, sectors that require physical presence. Interestingly, the Western states also show a mixed bag. California counties exhibit high remote work rates, while more rural areas in states like Idaho or Montana lag behind. The diversity of employment types, from tech startups to traditional agriculture, creates a varied landscape of remote work potential.
Significance and Impact
Understanding the geographic distribution of remote work is crucial for numerous reasons. First, it allows policymakers to address gaps in infrastructure and support services. For instance, areas with low remote work percentages may benefit from investments in broadband internet or workforce training programs to prepare workers for the future job market. Moreover, businesses can make informed decisions regarding location and investment, targeting areas with higher remote work capabilities and potential talent pools. As remote work becomes a lasting feature of employment, communities may need to adapt their economic strategies to attract remote workers, including enhancing local amenities or promoting a more flexible work-life balance. Looking forward, the trend toward remote work appears to be here to stay. Projections suggest that by 2025, nearly 30% of the workforce could be permanently remote, leading to significant shifts in housing markets, urban planning, and local economies. Have you noticed how some towns are even promoting themselves as remote work-friendly destinations? This trend could reshape the way we think about workspaces and living arrangements in the years to come.
Visualization Details
- Published
- September 1, 2025
- Views
- 90
Comments
Loading comments...