Global Public Company Market Capitalization by Country Map

Alex Cartwright
Senior Cartographer & GIS Specialist
Alex Cartwright is a renowned cartographer and geographic information systems specialist with over 15 years of experience in spatial analysis and data...
Geographic Analysis
What This Map Shows
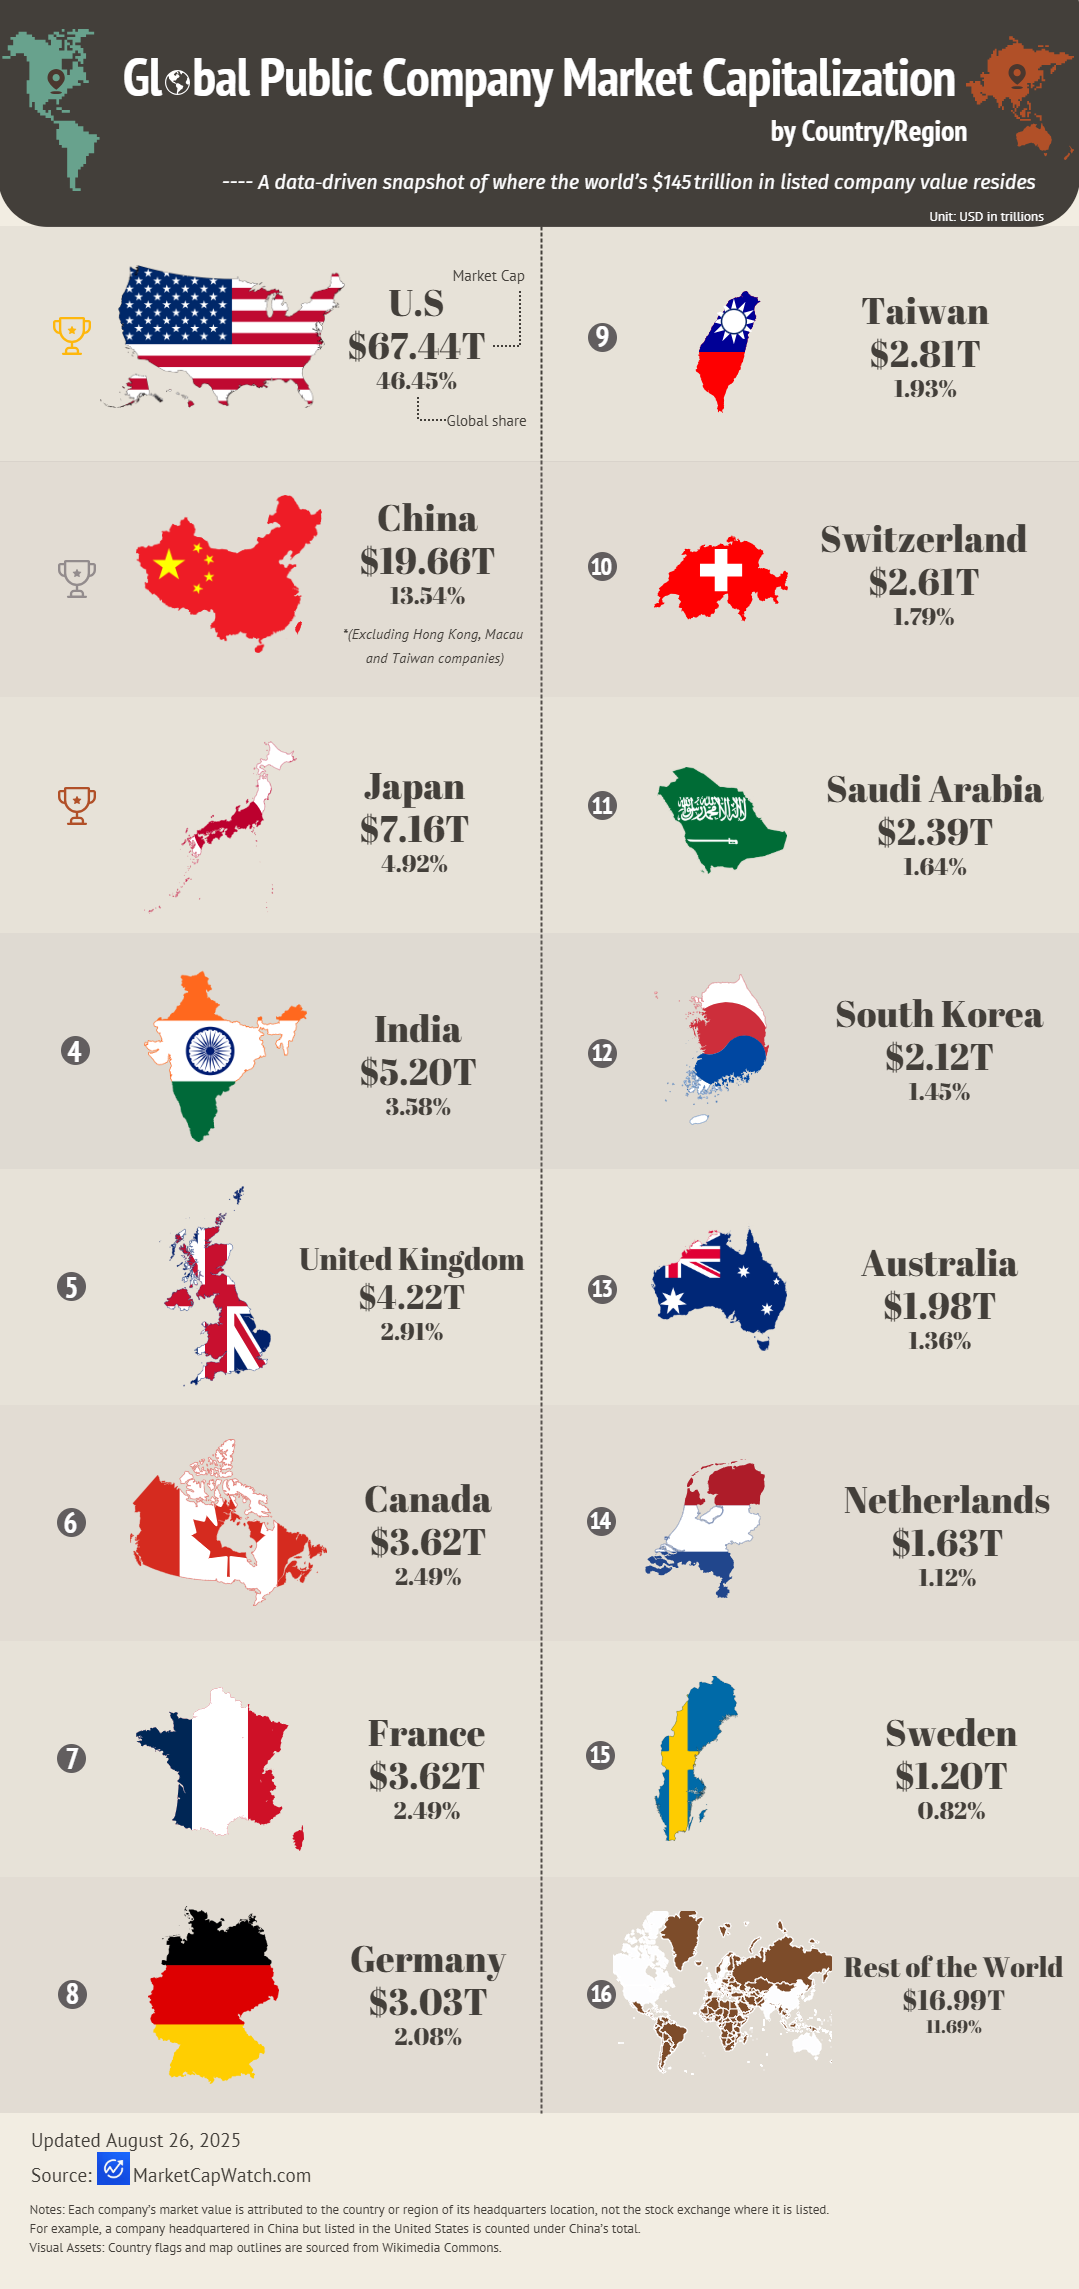
The Global Public Company Market Capitalization by Country Map visualizes the economic weight of publicly traded companies across various countries and regions. Market capitalization, or the total value of a company's outstanding shares, serves as a crucial indicator of economic health and investor confidence. By examining this map, you can identify which nations are home to the largest and most influential companies, offering a snapshot of global economic dynamics.
Deep Dive into Market Capitalization
Market capitalization is more than just a number; it reflects the business environment and economic stability of a nation. The concept is rooted in how investors perceive a company’s potential for growth. Interestingly, a higher market cap often indicates a company’s ability to exert influence in its sector, and this can be a reflection of broader economic trends within a country.
For instance, the United States stands out prominently on the map, accounting for a significant portion of global market capitalization. Major companies like Apple, Microsoft, and Amazon not only lead in market cap but also in innovation and technology. The U.S.’s robust financial markets, strong regulatory environment, and access to venture capital play a vital role in nurturing these companies. Have you noticed how Silicon Valley has become synonymous with tech startups? This is no coincidence; the ecosystem there is designed to foster rapid growth and attract talent.
In contrast, emerging economies like India and Brazil show a different picture. India, with its rapidly growing tech sector, has seen companies like Tata Consultancy Services and Reliance Industries make significant strides in market capitalization. Brazil, on the other hand, has companies like Petrobras and Vale, which dominate the market but also face challenges such as political instability and economic fluctuations. This disparity highlights how market capitalization can reflect not just the success of individual companies, but also the overall economic landscape of a country.
Furthermore, sectors play a crucial role in influencing market capitalization. The tech sector, for instance, has outpaced traditional industries like manufacturing or agriculture in many countries. This shift is evident in the increased market caps of tech giants compared to their counterparts in more traditional sectors. Interestingly, the global pandemic accelerated this trend, as companies that adapted to digital transformation saw their market values soar, reshaping the economic landscape.
Regional Analysis
When analyzing the map regionally, North America dominates the landscape, not just in sheer numbers but also in diversity across sectors. The presence of leading tech firms, pharmaceutical giants, and financial institutions collectively boosts the market cap significantly.
Europe, while home to many established companies, faces more economic fragmentation. Countries like Germany and the UK have notable firms such as SAP and Unilever, respectively. However, the varying degrees of market cap among European nations can be attributed to differing economic policies and market structures. Interestingly, the European Union's regulations can sometimes impact how companies grow their market cap compared to the more flexible U.S. market.
In Asia, Japan and China present contrasting scenarios. Japan boasts established corporations like Toyota and Sony, which have large market caps but are facing challenges in innovation compared to their Chinese counterparts. China's rapid growth, driven by companies like Alibaba and Tencent, showcases a significant rise in market capitalization, which has implications for global trade and investment.
Significance and Impact
Understanding market capitalization by country not only provides insights into the economic health of nations but also helps gauge investor sentiment and potential future trends. In an increasingly interconnected world, shifts in market cap can signal broader economic changes, such as emerging markets gaining ground or established ones facing obsolescence.
Current trends indicate that as technology continues to evolve, countries that invest in innovation and digital infrastructure may see their market capitalizations rise. This could lead to a shift in global economic power, with some emerging markets possibly overtaking traditional powerhouses. Ever wondered how the world might look 10 years from now? The map of market capitalization could tell a story of transformation and adaptation, reflecting the ongoing changes in global commerce and investment strategies.
By closely examining these patterns, policymakers and investors can make informed decisions, ensuring that they stay ahead in a rapidly evolving economic landscape. Whether you’re a student of geography, an investor, or just someone curious about world economies, understanding this map is crucial for grasping the pulse of global markets.
Visualization Details
- Published
- August 27, 2025
- Views
- 92
Comments
Loading comments...