Night-time Light Map of Asia 2012 vs 2024

David Chen
Data Visualization Specialist
David Chen is an expert in transforming complex geographic datasets into compelling visual narratives. He combines his background in computer science ...
Geographic Analysis
What This Map Shows
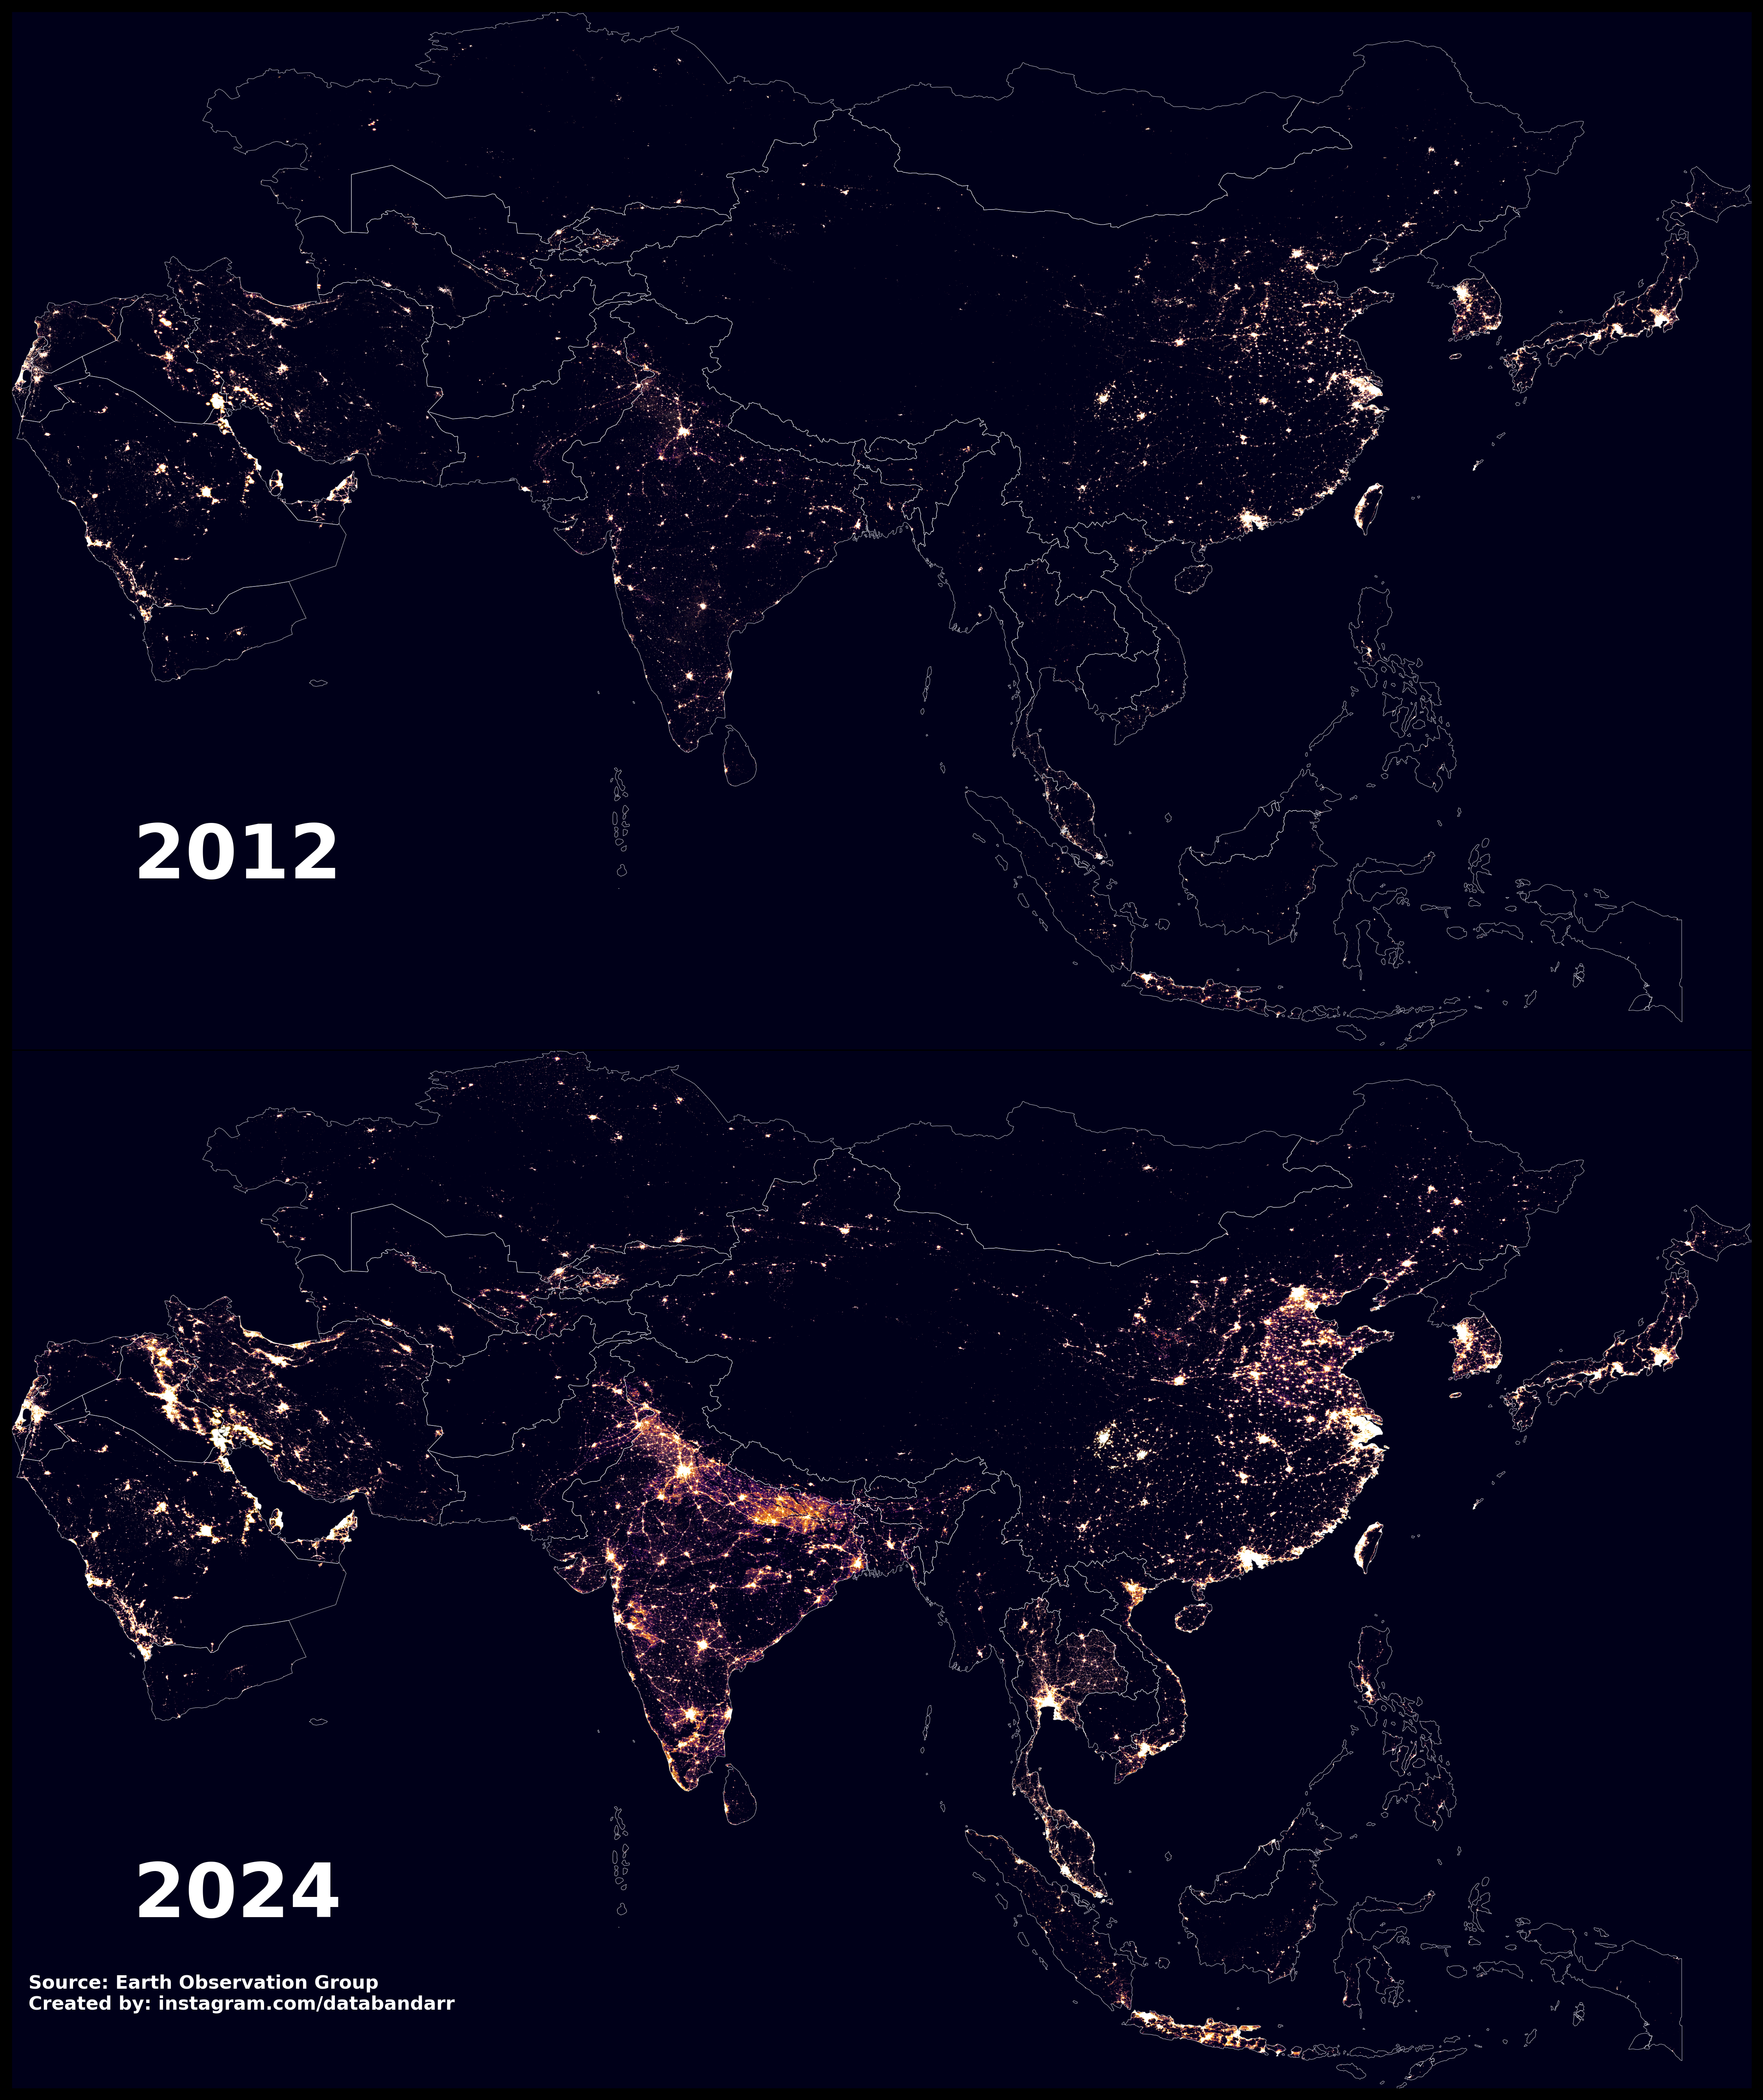
The "Night-time Light in Asia, 2012 vs 2024" map presents a striking visual comparison of light emissions across various regions of Asia over an interval of twelve years. Night-time lights are a useful proxy for human activity, economic development, urbanization, and environmental changes. As we delve into this map, we can observe how the brightness of different areas not only reflects population density but also the energy consumption patterns, infrastructure growth, and urban expansion that have occurred during this period.
Deep Dive into Night-time Light and Its Implications
Night-time lights captured through satellite imagery offer a unique lens through which we can examine human activity on the planet. The phenomenon of urbanization, particularly in Asia, has been profound. Cities are growing exponentially, leading to increased economic activities and, consequently, higher energy consumption. This visible light at night is not merely a display of brightness; it is a measure of progress.
Interestingly, this form of data can indicate where investments have been made, where infrastructure has improved, and where populations have surged. For instance, regions that were previously dark in 2012 have now lit up in 2024, showcasing new developments. Major metropolitan areas like Beijing, Shanghai, and Mumbai have not only expanded in population but also in the infrastructure that supports them, including roads, buildings, and energy grids.
Moreover, differences in light intensity can reflect disparities in development and economic status. Regions that are well-lit typically indicate higher economic activity and investment, while darker areas may point to rural underdevelopment or even environmental degradation.
In a broader context, the night-time light data can be correlated with various socio-economic indicators such as GDP growth and poverty levels. For instance, countries like Vietnam and Bangladesh have displayed marked increases in light emissions, hinting at rapid urbanization and economic growth. Conversely, areas in conflict or facing economic decline, such as parts of Afghanistan, remain dim, indicating stagnation or regression.
Regional Analysis
Breaking down the map by specific regions brings to light some intriguing dynamics. In East Asia, the growth of cities like Shenzhen and Guangzhou can be observed as they become increasingly illuminated between 2012 and 2024. These cities have seen massive inflows of people and capital, making them some of the brightest spots on the map.
Southeast Asia presents a contrasting picture. Countries like Indonesia and the Philippines have seen a mix of brightening in urban centers alongside darker rural regions. For instance, while Jakarta continues to glow brighter, rural areas in Java and Sumatra remain less illuminated, highlighting the urban-rural divide in development.
In South Asia, India exemplifies the dichotomy of growth. While cities like Bangalore and Hyderabad shine brightly, representing burgeoning tech hubs, nearby rural regions still lack sufficient infrastructure and connectivity, resulting in stark differences in light levels. Similarly, Pakistan's major urban centers like Karachi and Lahore display a significant increase in night-time light, indicating urban growth and economic activity.
Significance and Impact
So, why does the study of night-time lights matter? The implications of this data are wide-ranging. Understanding where human activity is concentrated can guide policymakers in resource allocation and urban planning. As cities grow, the need for sustainable development becomes increasingly critical to manage environmental impacts.
Additionally, as we look toward the future, projections suggest that urban areas in Asia will continue to expand. The United Nations projects that by 2050, 68% of the world’s population will live in urban areas, with a significant portion in Asia. Hence, understanding the patterns of night-time lights is not just an academic exercise; it’s a crucial aspect of planning for sustainable urban futures.
Furthermore, as energy consumption rises, there is a pressing need to transition to renewable sources. Night-time light data can help assess how effectively countries are moving towards greener energy solutions. Have you noticed that bright lights often correlate with higher carbon footprints? This relationship underscores the urgent need for addressing climate change alongside urban expansion.
In summary, the "Night-time Light in Asia, 2012 vs 2024" map serves as a powerful visual tool that encapsulates the complex interplay of urbanization, economic growth, and environmental challenges in Asia. By examining these patterns, we can better understand the trajectory of development and the necessary steps towards sustainable practices for the future.
Visualization Details
- Published
- August 22, 2025
- Views
- 84
Comments
Loading comments...