East Asian Population Distribution Map in Greater Vancouver

Marcus Rodriguez
Historical Geography Expert
Marcus Rodriguez specializes in historical cartography and geographic data analysis. With a background in both history and geography, he brings unique...
Geographic Analysis
What This Map Shows
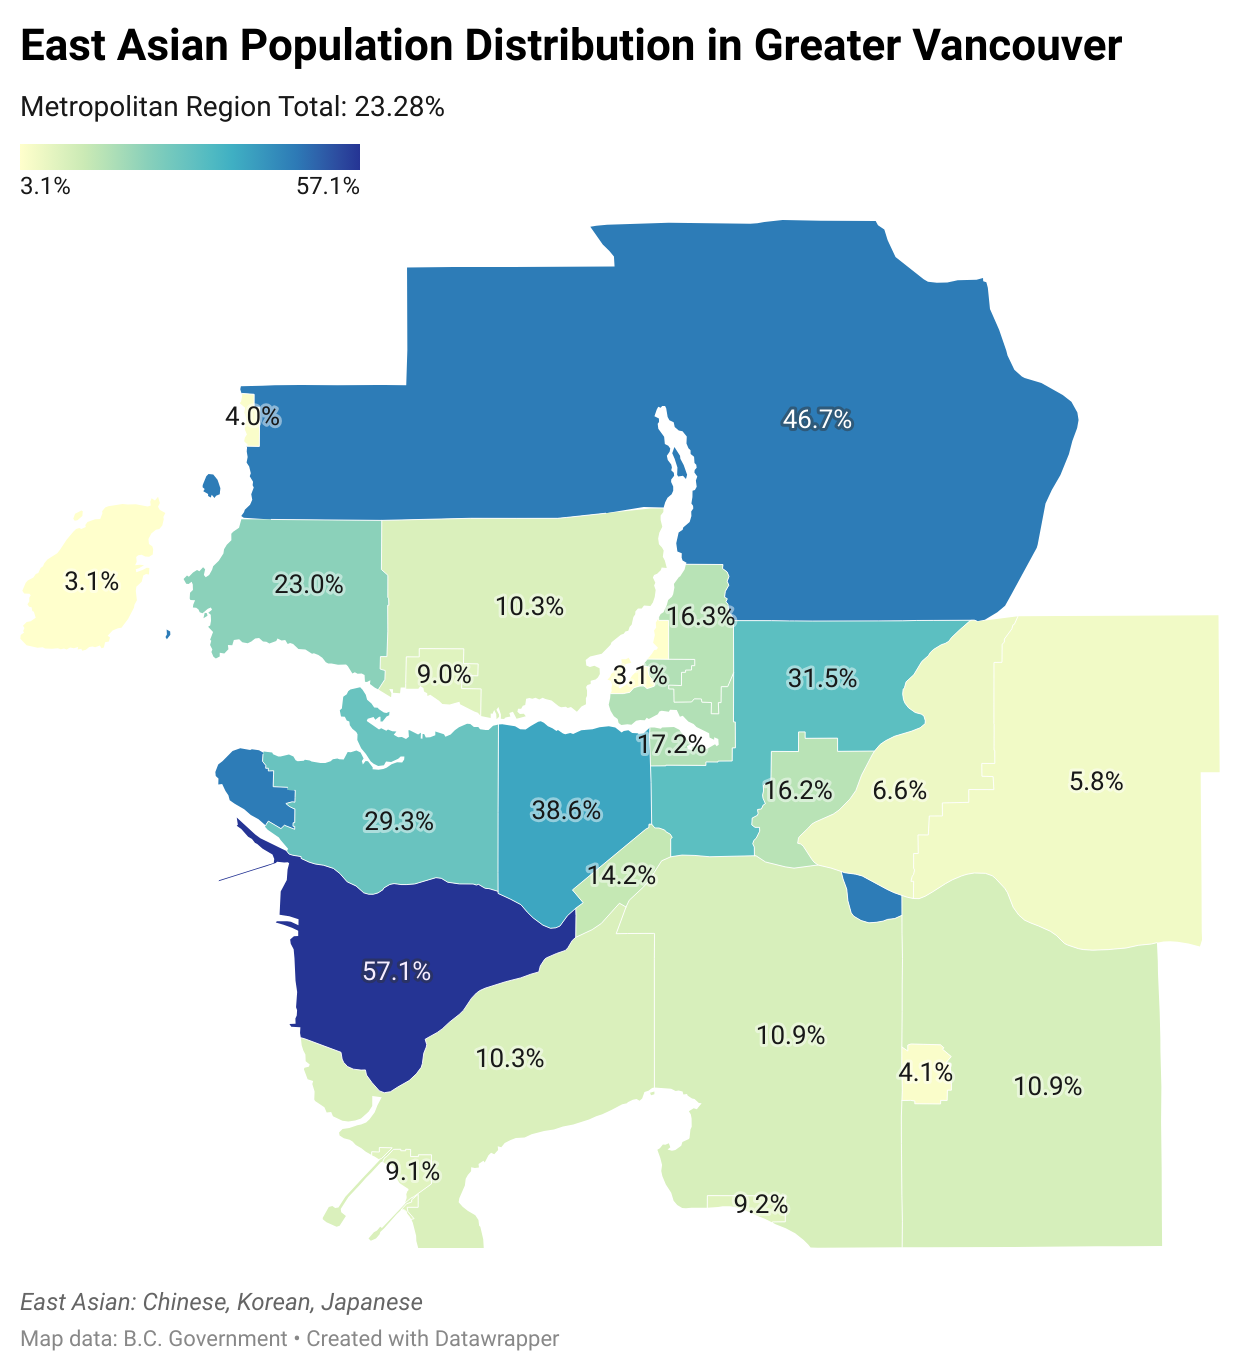
The East Asian Population Distribution Map in Greater Vancouver provides a detailed visualization of the demographic spread of East Asian communities throughout this vibrant Canadian city. Based on the 2021 Census Canada data, the map highlights where individuals of East Asian descent predominantly reside, allowing viewers to grasp the geographical nuances of these populations. This visualization is not just a collection of data points; it tells the story of migration, cultural integration, and urban development within Greater Vancouver.
Deep Dive into East Asian Population Distribution
The East Asian population in Greater Vancouver comprises individuals with roots in countries such as China, Japan, Korea, and Vietnam. As of the 2021 Census, approximately 29.5% of the total population in Greater Vancouver identifies as part of a visible minority group, with East Asians representing a significant portion. This demographic shift has transformed the city's cultural landscape, influencing everything from local cuisine to community events and educational opportunities.
Interestingly, the concentration of East Asian populations is not uniform across Greater Vancouver. Areas such as Richmond and Vancouver’s West End exhibit particularly high densities of East Asian residents. Richmond, for instance, is often touted as one of the most ethnically diverse municipalities in Canada, with over 55% of its population identifying as Asian, the majority of whom trace their heritage back to China. This concentration is partially due to historical migration patterns, with waves of Chinese immigrants arriving during the late 20th century, drawn by economic opportunities and the city’s welcoming environment.
The urban development in these areas reflects this demographic trend. Neighborhoods have evolved to cater to the needs and preferences of East Asian communities, with the proliferation of supermarkets, restaurants, and cultural festivals that celebrate East Asian heritage. For instance, the annual Vancouver Chinatown Festival is a testament to the rich cultural contributions of the Chinese community, drawing thousands each year to celebrate food, art, and tradition.
Furthermore, educational institutions in the area have adapted to this demographic shift. Schools in neighborhoods with a high concentration of East Asian students often offer programs that cater to diverse cultural backgrounds, fostering an inclusive environment for all students. This demographic dynamism not only enriches the local culture but also poses unique challenges and opportunities for urban planners and policymakers.
Regional Analysis
When examining the map, notable variations emerge between different regions in Greater Vancouver. In Richmond, for instance, the East Asian population is not only large but also deeply integrated into the local economy. The presence of numerous Asian grocery stores and restaurants speaks to the community's influence on the local market. In contrast, while Vancouver's West End also hosts a substantial East Asian population, the demographic is more mixed, displaying a broader range of ethnicities and cultural influences.
North Vancouver, on the other hand, shows a lower concentration of East Asian residents, which can be attributed to higher housing costs and different cultural attractions. The demographic diversity here is more varied, including a mix of European and South Asian communities, indicating that socio-economic factors play a significant role in determining where populations choose to settle.
Interestingly, the presence of East Asian populations in suburban areas such as Surrey is on the rise. This shift reflects broader trends in urban migration, where families seek more affordable housing while still maintaining close ties to urban centers for work and social interactions. The map captures these dynamics, illustrating how population distribution can change over time due to economic and social factors.
Significance and Impact
Understanding the East Asian population distribution in Greater Vancouver is crucial for numerous reasons. It informs city planners about housing needs, public transportation requirements, and community services. Additionally, this demographic insight is invaluable for businesses looking to cater to specific cultural preferences, aiding in marketing strategies and product offerings.
Moreover, the implications of these population trends extend into the political realm, where representation and community advocacy become essential. As the East Asian community continues to grow, their voices in local governance and decision-making processes become increasingly vital.
Looking ahead, projections indicate that the East Asian population in Greater Vancouver will continue to grow, driven by both immigration and natural population increase. Understanding these trends now can help shape the future of this city's cultural landscape, ensuring that it remains a welcoming and inclusive place for all its residents. Ever wondered how these shifts might influence the future of urban development or community relations? The answer lies in how well we understand and adapt to these dynamic demographic changes.
Visualization Details
- Published
- August 11, 2025
- Views
- 304
Comments
Loading comments...