Geographic Visualizations
Explore our curated collection of fascinating geographic visualizations and cartographic analyses. Discover detailed maps, data visualizations, and geographical insights from around the world.
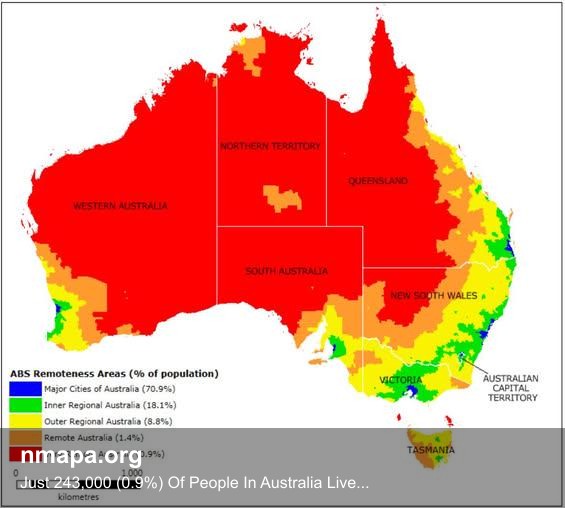
Just 243,000 (0.9%) Of People In Australia Live In The Red Area Map
Geographic Analysis7/31/2025
## What This Map Shows...
80 viewsRead More →
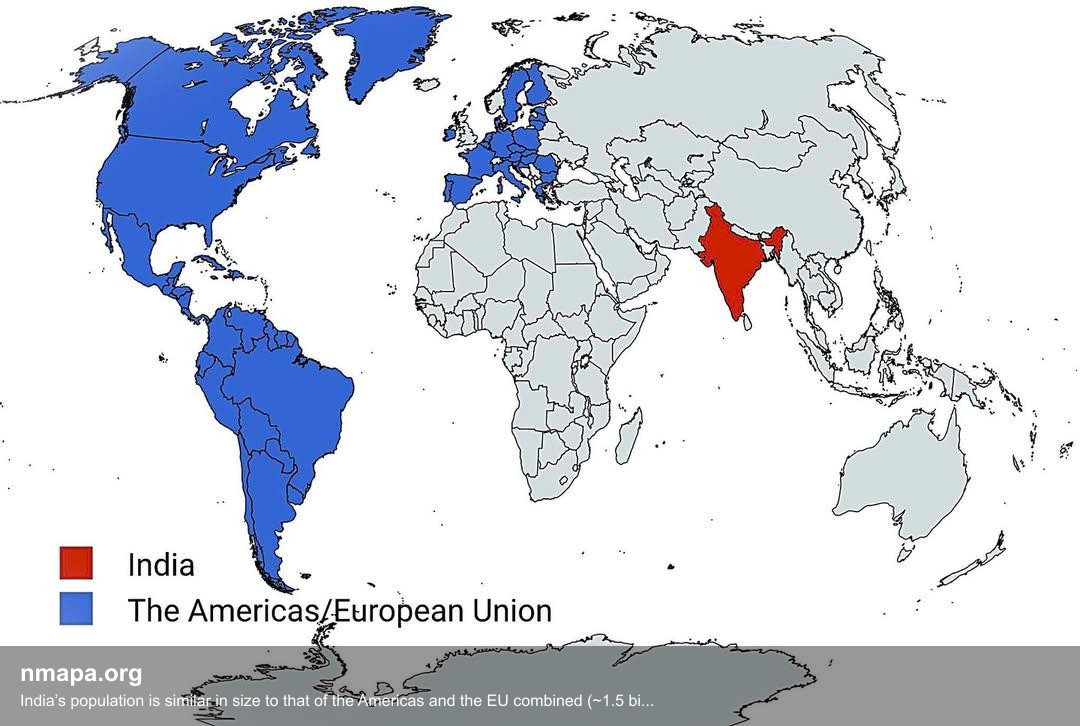
Population Map: India’s population is similar in size to that of the Americas and the EU combined (~1.5 billion)
Geographic Analysis7/31/2025
## What This Map Shows...
104 viewsRead More →
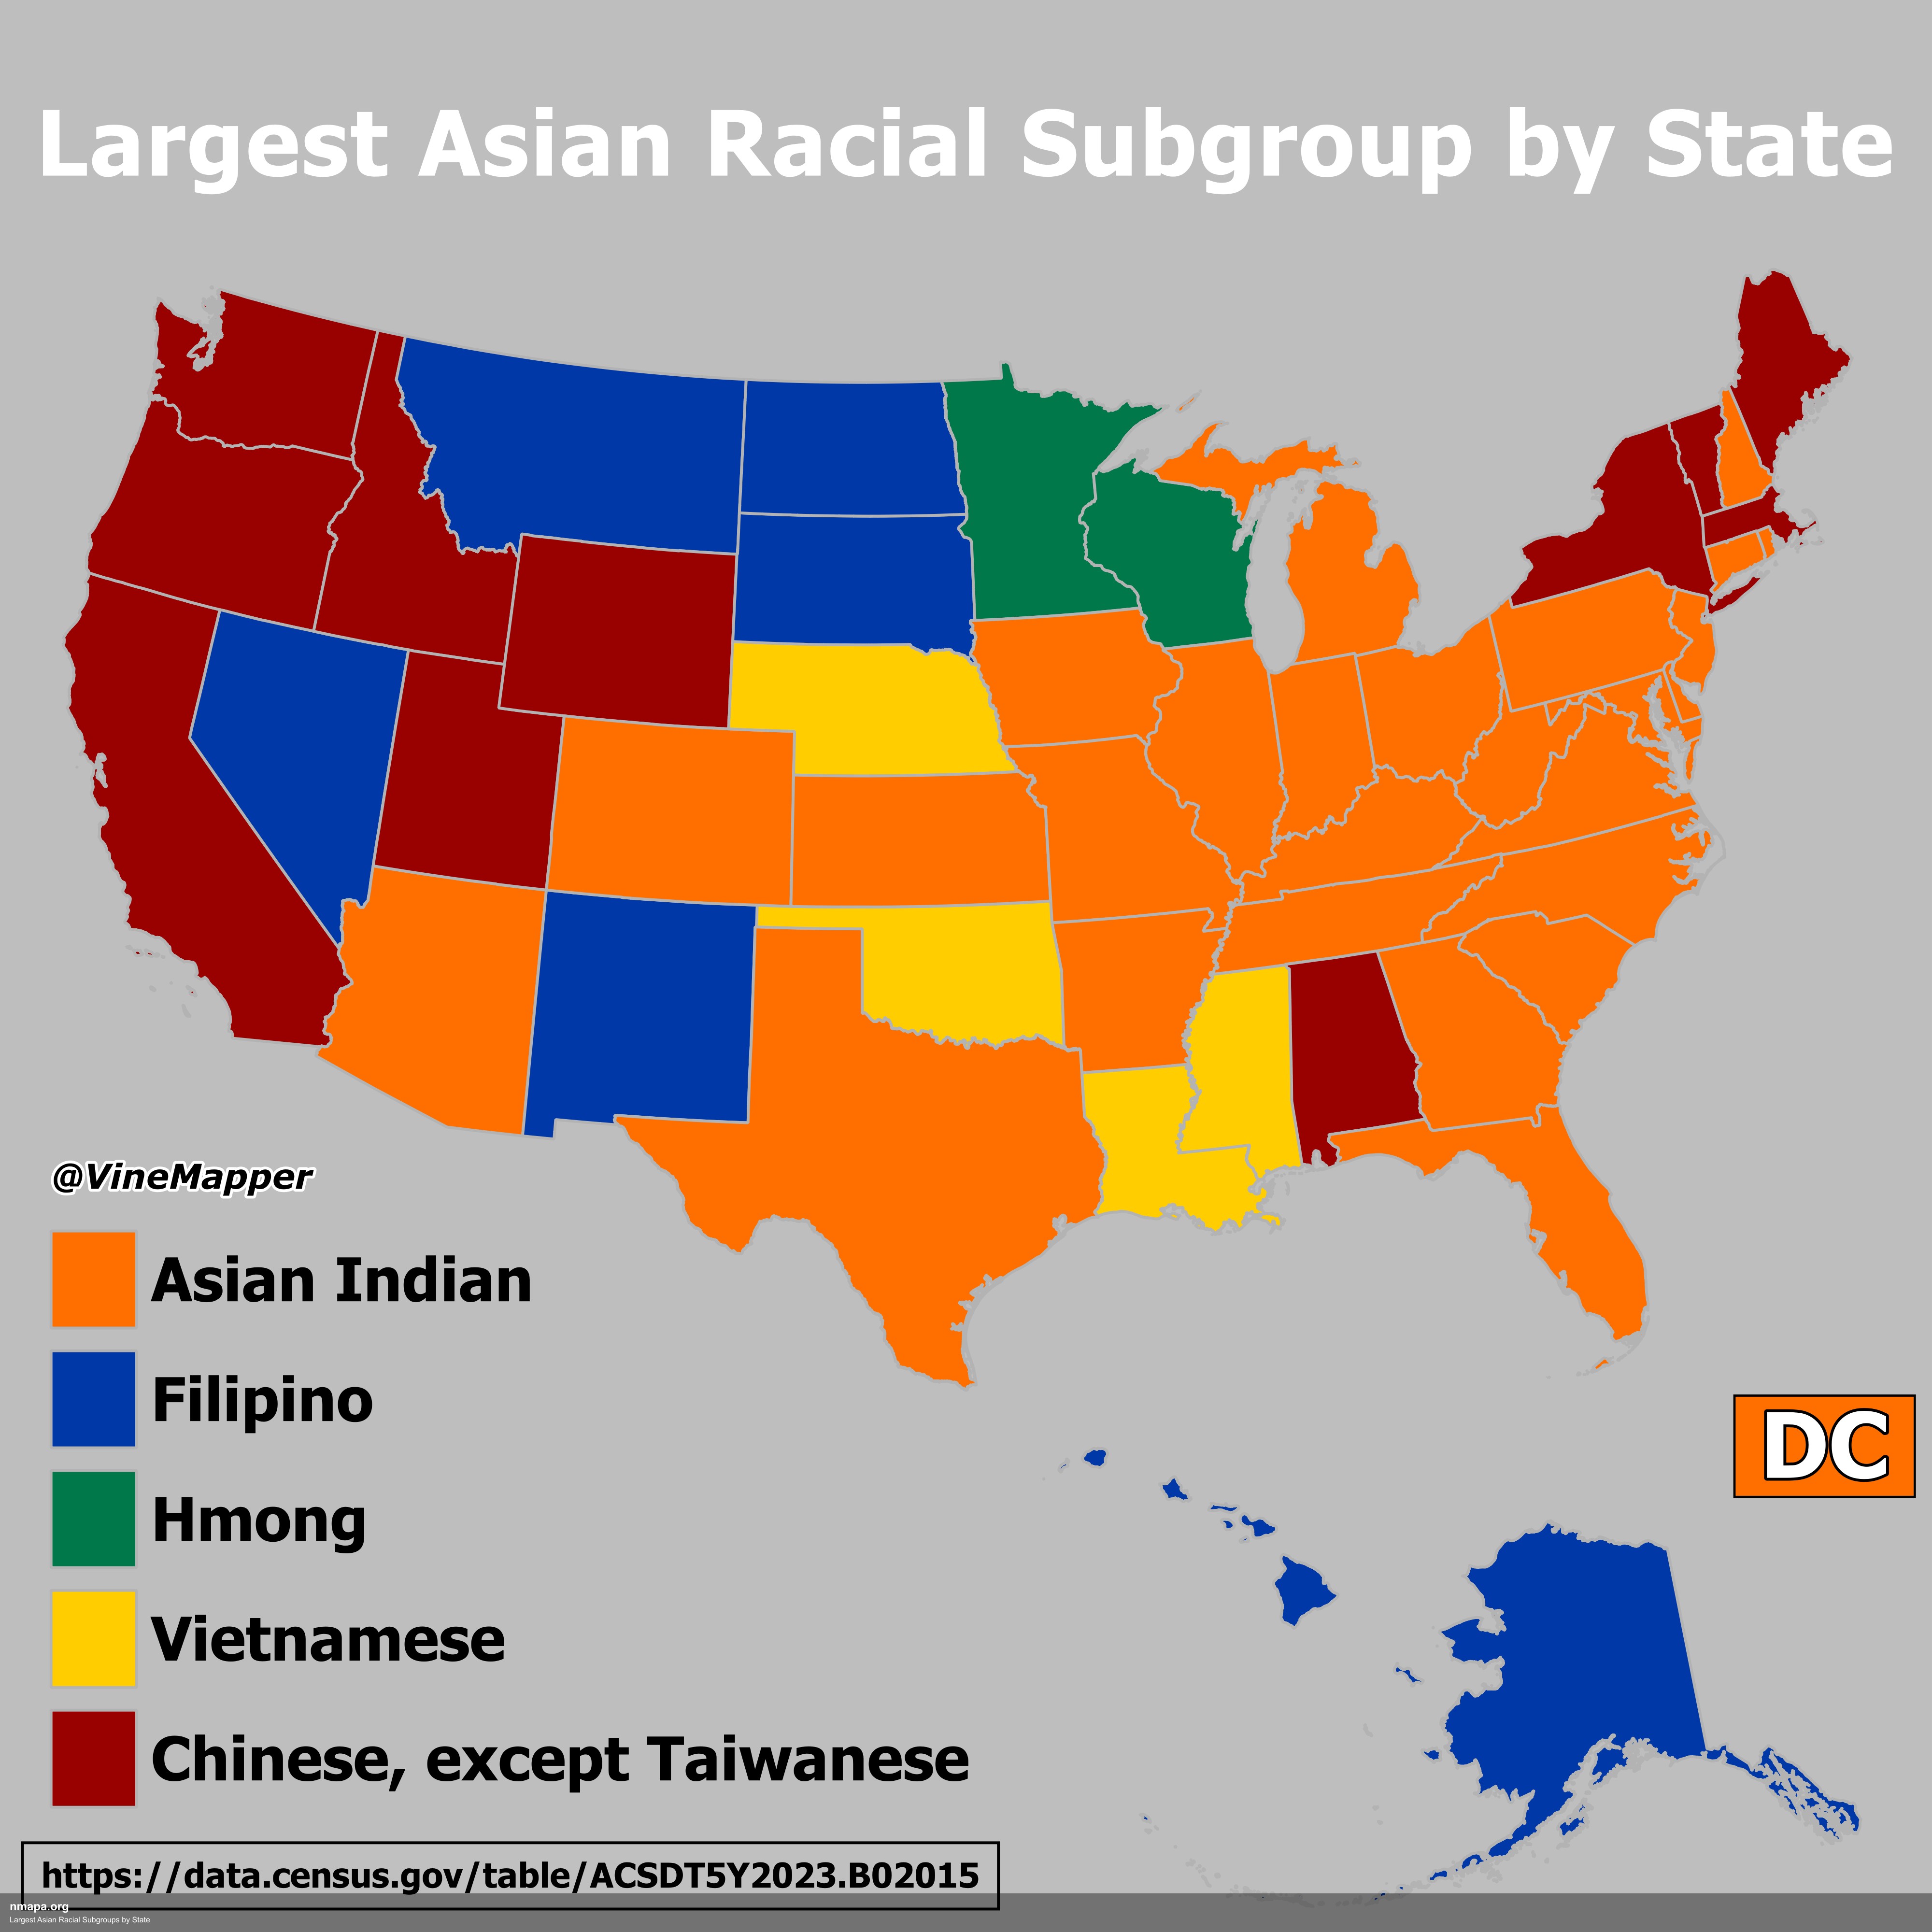
Largest Asian Racial Subgroups by State Map
Geographic Analysis7/31/2025
## What This Map Shows...
104 viewsRead More →
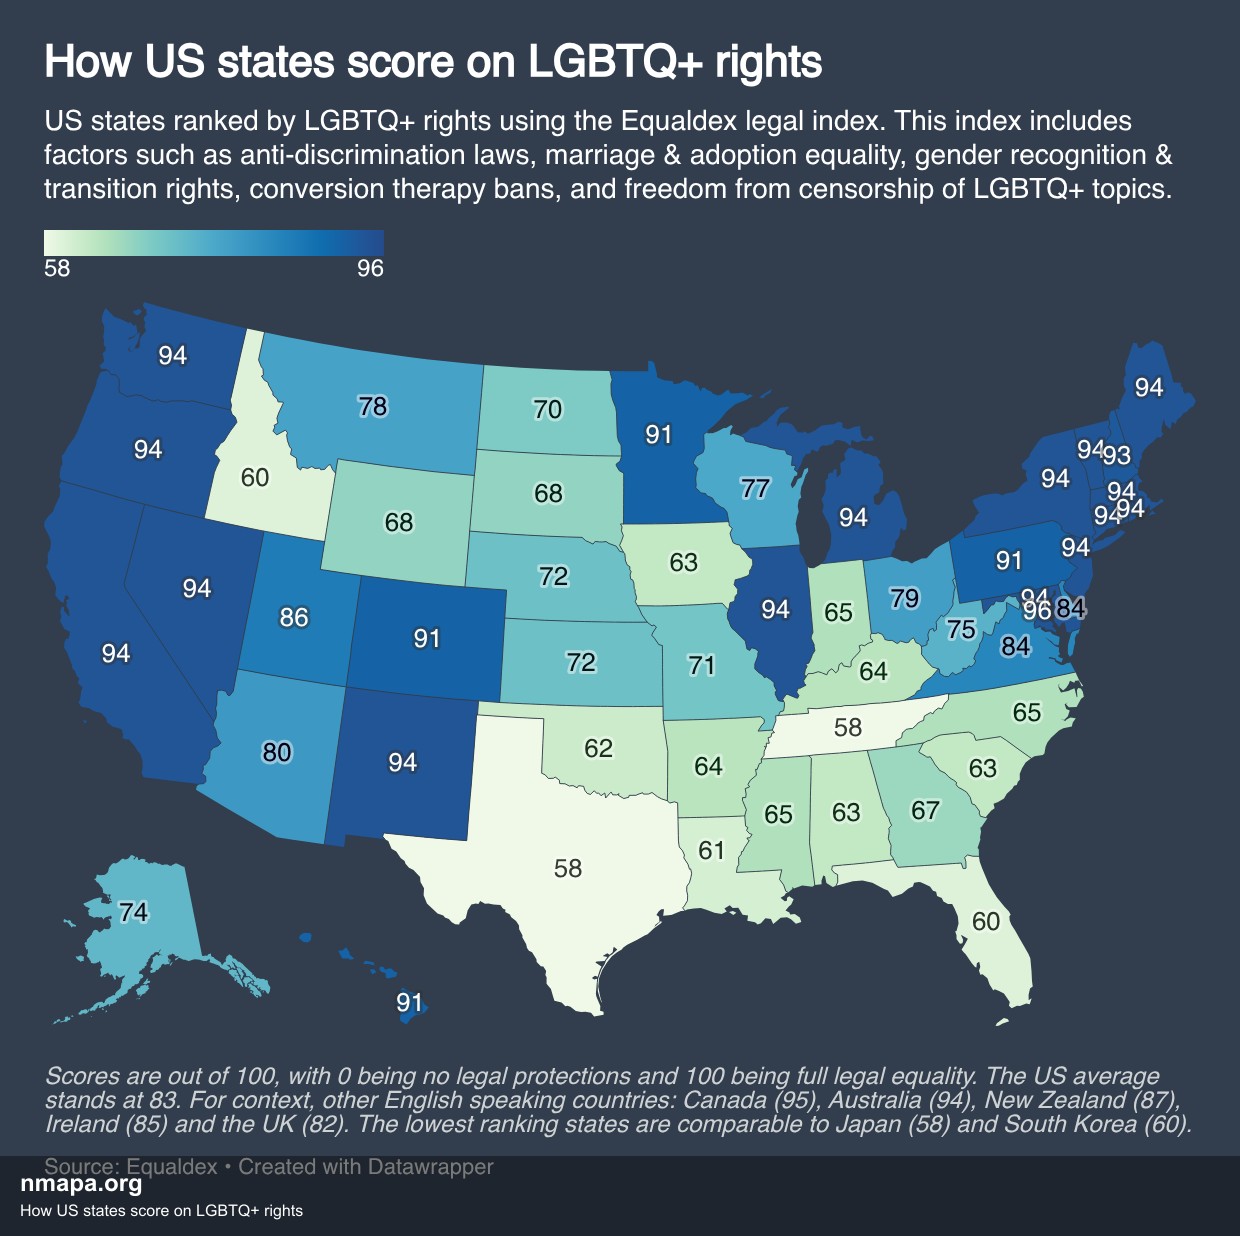
How US states score on LGBTQ+ rights Map
Geographic Analysis7/31/2025
## What This Map Shows...
92 viewsRead More →
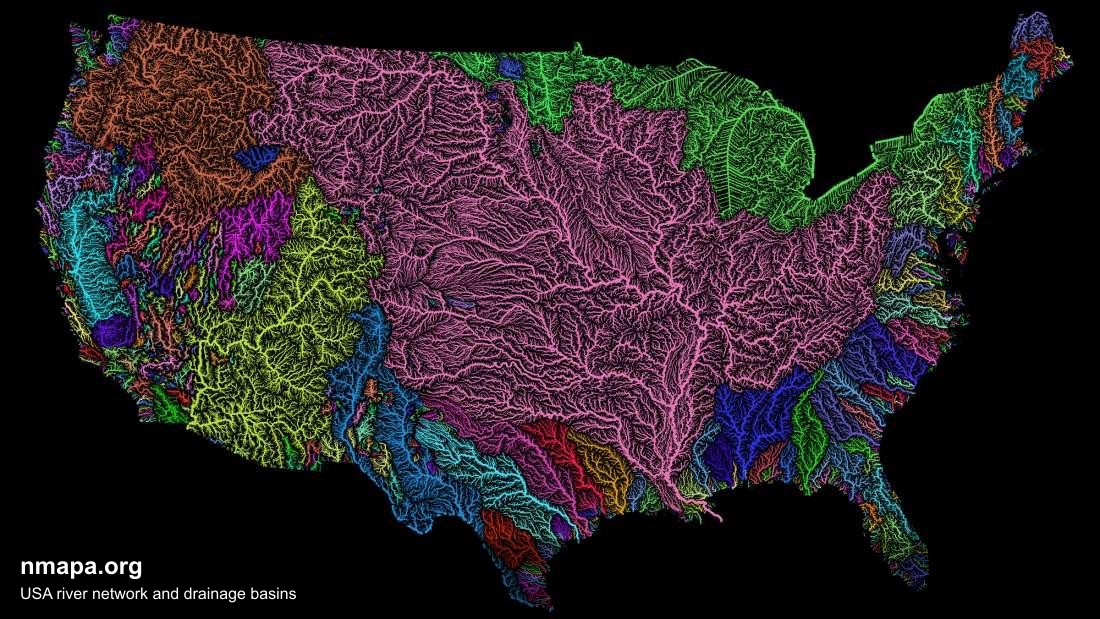
USA river network and drainage basins Map
Geographic Analysis7/31/2025
## What This Map Shows...
186 viewsRead More →
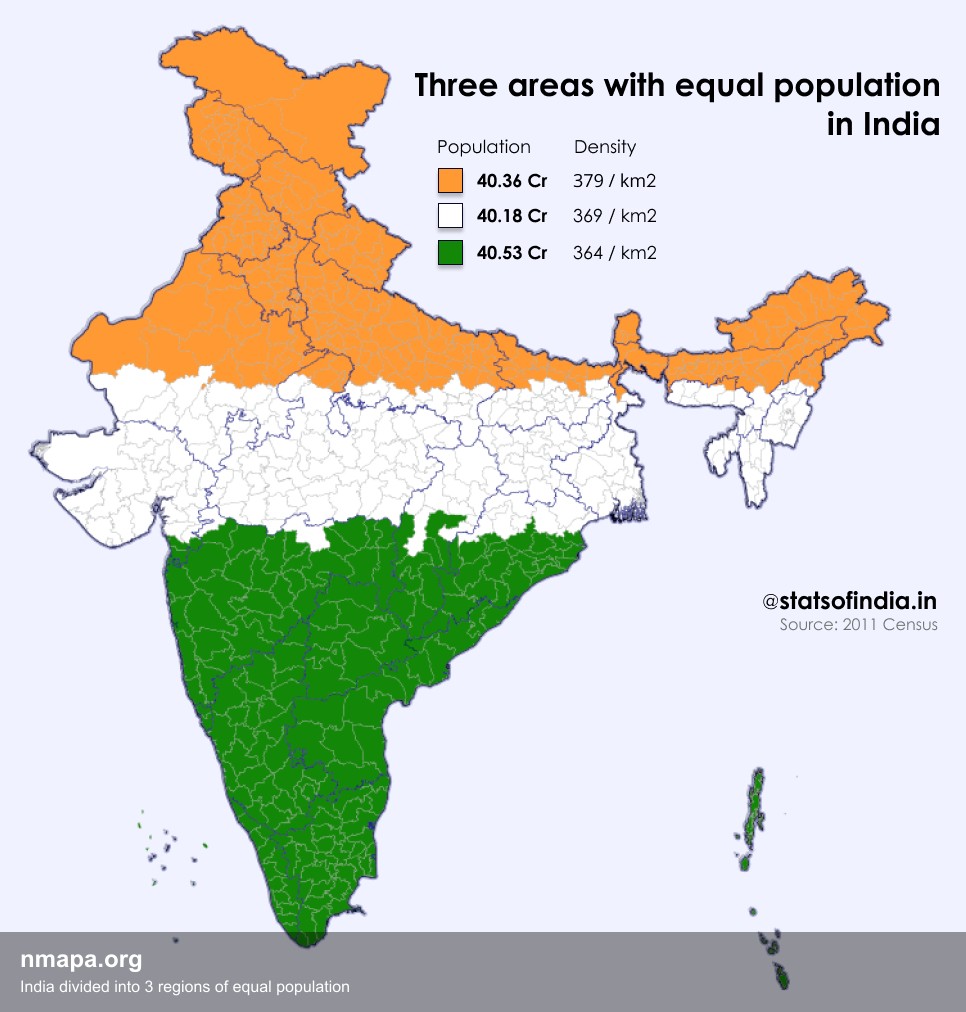
Population Map: India divided into 3 regions of equal population
Geographic Analysis7/31/2025
## What This Map Shows...
92 viewsRead More →