Black/White Incarceration Ratios in the US Map

David Chen
Data Visualization Specialist
David Chen is an expert in transforming complex geographic datasets into compelling visual narratives. He combines his background in computer science ...
Geographic Analysis
What This Map Shows
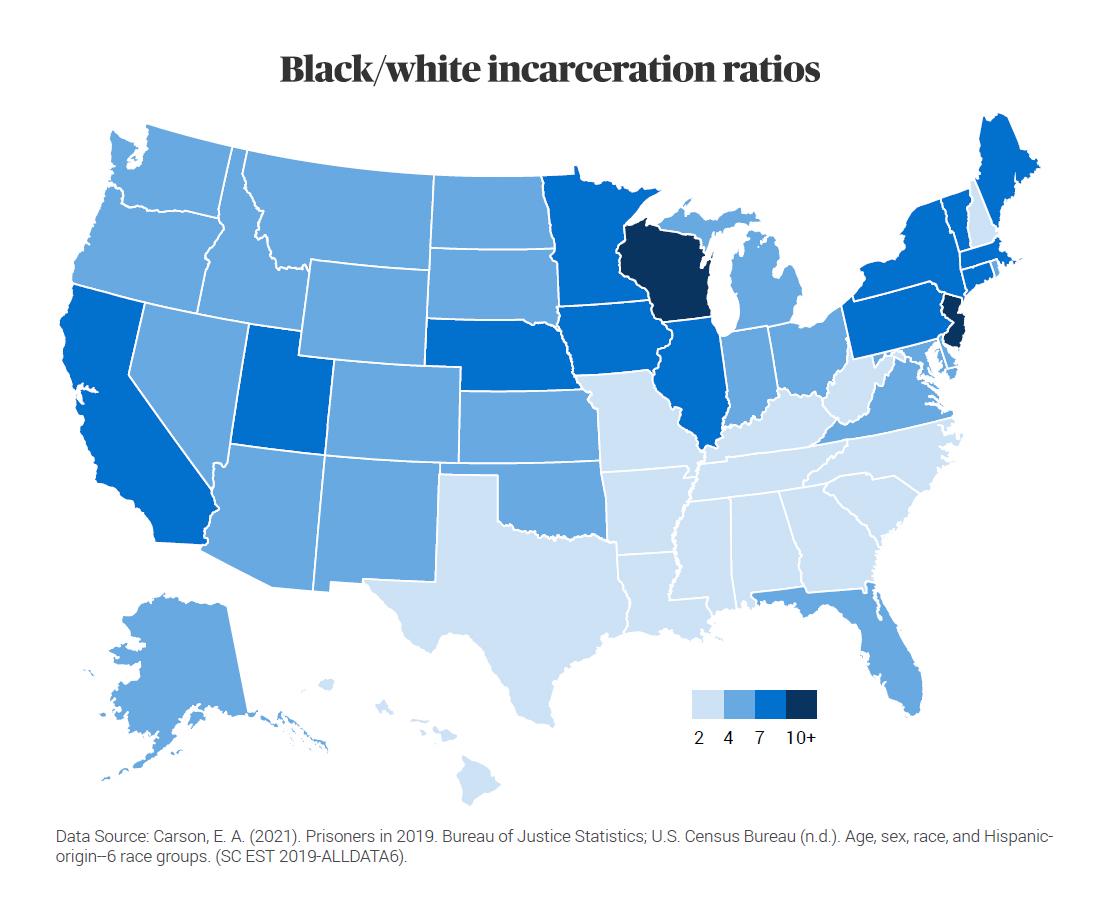
The "Black/White Incarceration Ratios in the US (2021)" map provides a stark visual representation of the disparities in incarceration rates between Black and White individuals across different states. By displaying ratios that indicate how many Black individuals are incarcerated compared to their White counterparts, this map sheds light on one of the most pressing social justice issues in contemporary America. The ratios vary significantly from state to state, indicating systemic issues that go beyond mere statistics and touch on the fabric of American society.
Deep Dive into Incarceration Trends
Incarceration rates in the U.S. have been a focal point of discussion for decades, particularly as they relate to race. According to the Bureau of Justice Statistics, Black Americans are incarcerated at rates that are disproportionately higher than their White peers. As of 2021, Black individuals made up approximately 33% of the total prison population despite only accounting for around 13% of the U.S. population. This discrepancy is not just a reflection of crime rates; it is deeply intertwined with historical, social, and economic factors.
One of the key elements influencing these ratios is the legacy of systemic racism that permeates various institutions, including law enforcement and the judiciary. For instance, studies show that Black Americans are more likely to be stopped, searched, and arrested than White Americans, often for the same types of offenses. What's fascinating is that even when controlling for similar types of crimes, sentencing disparities often result in longer prison terms for Black individuals.
Moreover, socioeconomic factors play a crucial role. High poverty rates in many Black communities often correlate with higher crime rates, leading to a vicious cycle of incarceration. Education and employment opportunities are also markedly different, which can exacerbate these issues. Communities with less access to quality education and stable jobs see higher rates of incarceration, further widening the gap in incarceration ratios.
Interestingly, the impact of drug policies has also significantly influenced incarceration rates. The War on Drugs, which began in the 1980s, has disproportionately affected Black communities. For example, while White individuals and Black individuals use drugs at relatively similar rates, Black Americans are much more likely to be arrested and imprisoned for drug-related offenses. This policy-driven disparity highlights the importance of examining the broader context behind the numbers.
Regional Analysis
When examining the map, it’s essential to consider the variations across different regions in the U.S. For instance, states like Louisiana and Mississippi exhibit some of the highest Black/White incarceration ratios, often exceeding 5:1. These states have a long history of racial inequality and systemic oppression, which is reflected in their criminal justice systems.
On the other hand, states like Vermont and Maine show much lower ratios, often close to 1:1. These differences can be attributed to a combination of factors, including population demographics, law enforcement practices, and local policies. In Vermont, for example, the overall crime rate is lower, and there are more community-based alternatives to incarceration.
Interestingly, the West Coast shows a mixed picture. States like California have high overall incarceration rates but have seen a decrease in the Black/White ratio due to criminal justice reforms targeting the reduction of mandatory minimum sentences and an increased focus on rehabilitation. However, these improvements are not uniformly distributed across the state, with urban areas like Los Angeles showing more significant disparities compared to rural areas.
Significance and Impact
The implications of the incarceration ratios presented in this map extend far beyond mere statistics. They highlight deep-rooted issues of racial inequality, social injustice, and systemic bias that require urgent attention. As discussions about criminal justice reform gain momentum, understanding the nuances of these ratios is critical for policymakers aiming to create equitable solutions.
The current trend shows a growing awareness of the need for reform in the criminal justice system, with movements advocating for changes to sentencing laws and increased investment in community resources. However, challenges remain, particularly in states with entrenched practices that resist change. Looking forward, it is essential to engage in meaningful dialogue about these issues and work toward a more equitable system that recognizes the dignity and humanity of all individuals, regardless of race.
In summary, the "Black/White Incarceration Ratios in the US (2021)" map serves as a powerful reminder of the disparities that exist within the American criminal justice system. It prompts us to reflect on the societal structures at play and inspires action toward a more just future.
Visualization Details
- Published
- October 30, 2025
- Views
- 6
Comments
Loading comments...