Homeless Per Capita Across America Map

Alex Cartwright
Senior Cartographer & GIS Specialist
Alex Cartwright is a renowned cartographer and geographic information systems specialist with over 15 years of experience in spatial analysis and data...
Geographic Analysis
What This Map Shows
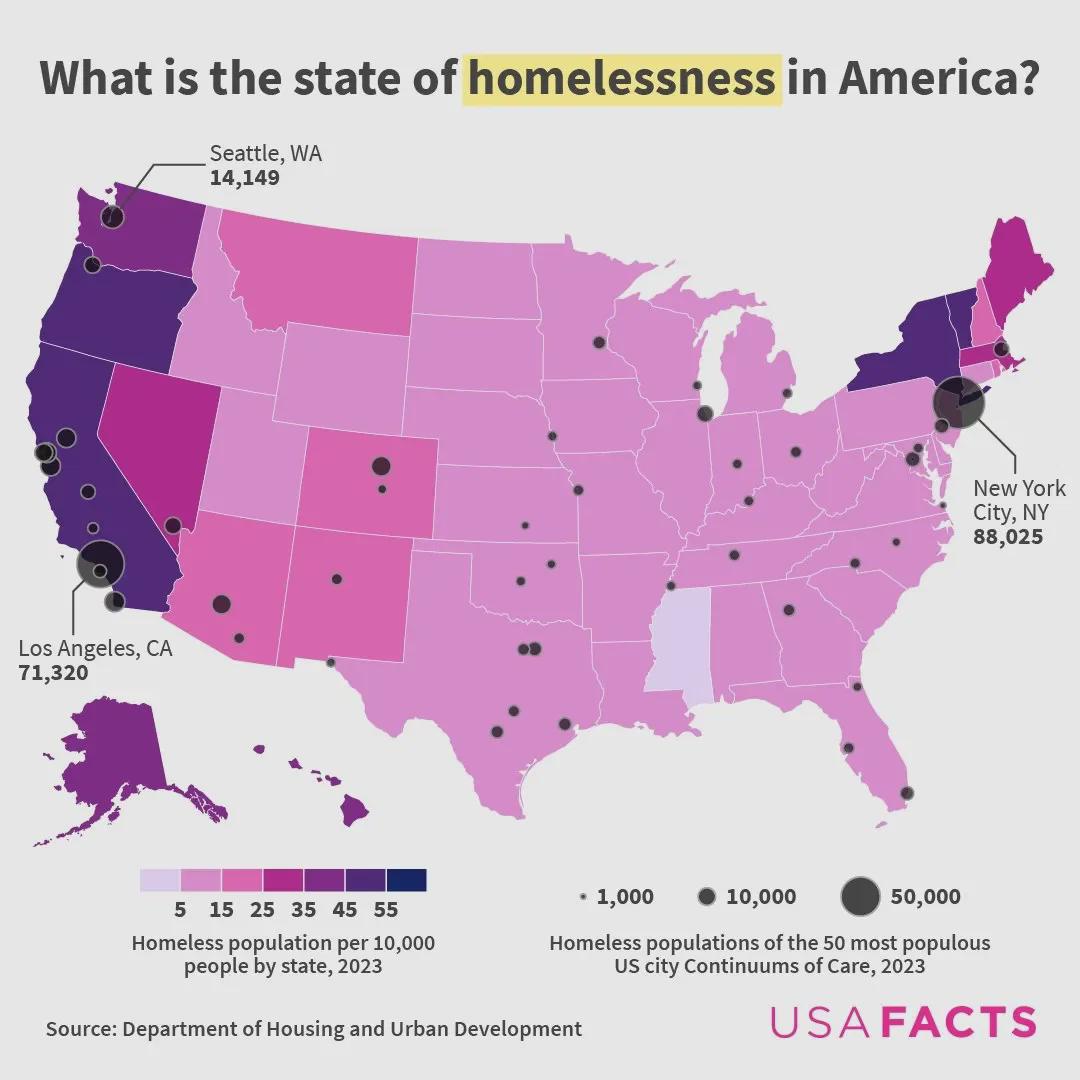
The "Homeless Per Capita Across America Map" offers a poignant visualization of homelessness rates throughout the United States. This map highlights how many individuals are experiencing homelessness in relation to the total population in various states and cities. By examining the data represented in this map, one can gain insights into the geographical distribution of homelessness, which is crucial for understanding the broader social issues tied to this challenge.
Deep Dive into Homelessness in America
Homelessness is a multifaceted issue that affects millions of individuals across the United States. As of the latest reports, approximately 650,000 people experience homelessness on any given night, according to the U.S. Department of Housing and Urban Development (HUD). This figure reflects not just a housing crisis but also systemic issues such as unemployment, mental health, and substance abuse. Interestingly, the causes of homelessness are often deeply rooted in social and economic factors, including income inequality, lack of affordable housing, and inadequate healthcare services.
One significant aspect of homelessness is its classification into various categories, such as chronic homelessness, families with children, and veterans. For instance, chronic homelessness is characterized by individuals who have experienced homelessness repeatedly or for extended periods, often due to severe mental illness or substance dependency. On the other hand, families with children make up a substantial portion of the homeless population, highlighting the intersection of poverty and family stability.
Data indicates that certain areas, particularly urban centers, experience higher rates of homelessness per capita. Cities like San Francisco and Los Angeles frequently top the charts with alarming rates, often exceeding 1% of their populations. For example, San Francisco has faced a homelessness crisis exacerbated by skyrocketing housing costs, which have outpaced wage growth, pushing many residents into precarious living situations. In contrast, rural areas may have lower numbers, but they face unique challenges, such as limited access to resources and support services.
The map not only reveals the stark disparities in homelessness rates but also raises questions about the efficacy of local policies and interventions. Some cities have implemented successful initiatives, like increased funding for supportive housing and mental health services, which have shown promising results in reducing homelessness. However, the need for comprehensive approaches that address the root causes of homelessness remains pressing.
Regional Analysis
When examining homelessness across different regions, the map provides an illuminating view of how socioeconomic factors contribute to the variations observed. In the West Coast, for instance, states like California and Oregon show significantly higher rates of homelessness per capita. California’s homeless population alone accounts for over 50% of the nation’s total, a staggering statistic that reflects both the demand for affordable housing and the challenges of mental health crises.
Conversely, states in the Midwest, such as Iowa and Nebraska, report much lower rates of homelessness. In these areas, the availability of affordable housing, combined with relatively stable economies, contributes to lower homelessness figures. What's fascinating is that while some regions show improvements due to effective local policies, others continue to struggle, underscoring the importance of tailored solutions that consider local conditions and needs.
The South also presents a mixed picture; states like Texas have seen rising homelessness rates, driven by urbanization and economic shifts. However, cities like Austin are actively working on policies to combat this issue, striving to balance growth with social responsibility.
Significance and Impact
Understanding homelessness and its geographical implications is critical for policymakers, social workers, and communities alike. The data represented in this map serves not only as a call to action but also as a tool for advocacy. By identifying areas with high rates of homelessness, stakeholders can allocate resources more effectively, implement targeted interventions, and raise awareness about the underlying issues contributing to homelessness.
Moreover, as urbanization continues to rise and economic disparities widen, the trends observed in this map are likely to evolve. Projections suggest that without significant policy changes, homelessness could increase, particularly in high-cost urban areas. Therefore, addressing this issue is not just a moral imperative but also a pressing societal challenge that requires collaboration among government entities, non-profits, and local communities.
In conclusion, the "Homeless Per Capita Across America Map" serves as a vital resource for understanding the complex landscape of homelessness in the U.S. It highlights the need for sustained efforts to tackle the root causes of this crisis and emphasizes the importance of community involvement in creating lasting change.
Visualization Details
- Published
- October 7, 2025
- Views
- 44
Comments
Loading comments...