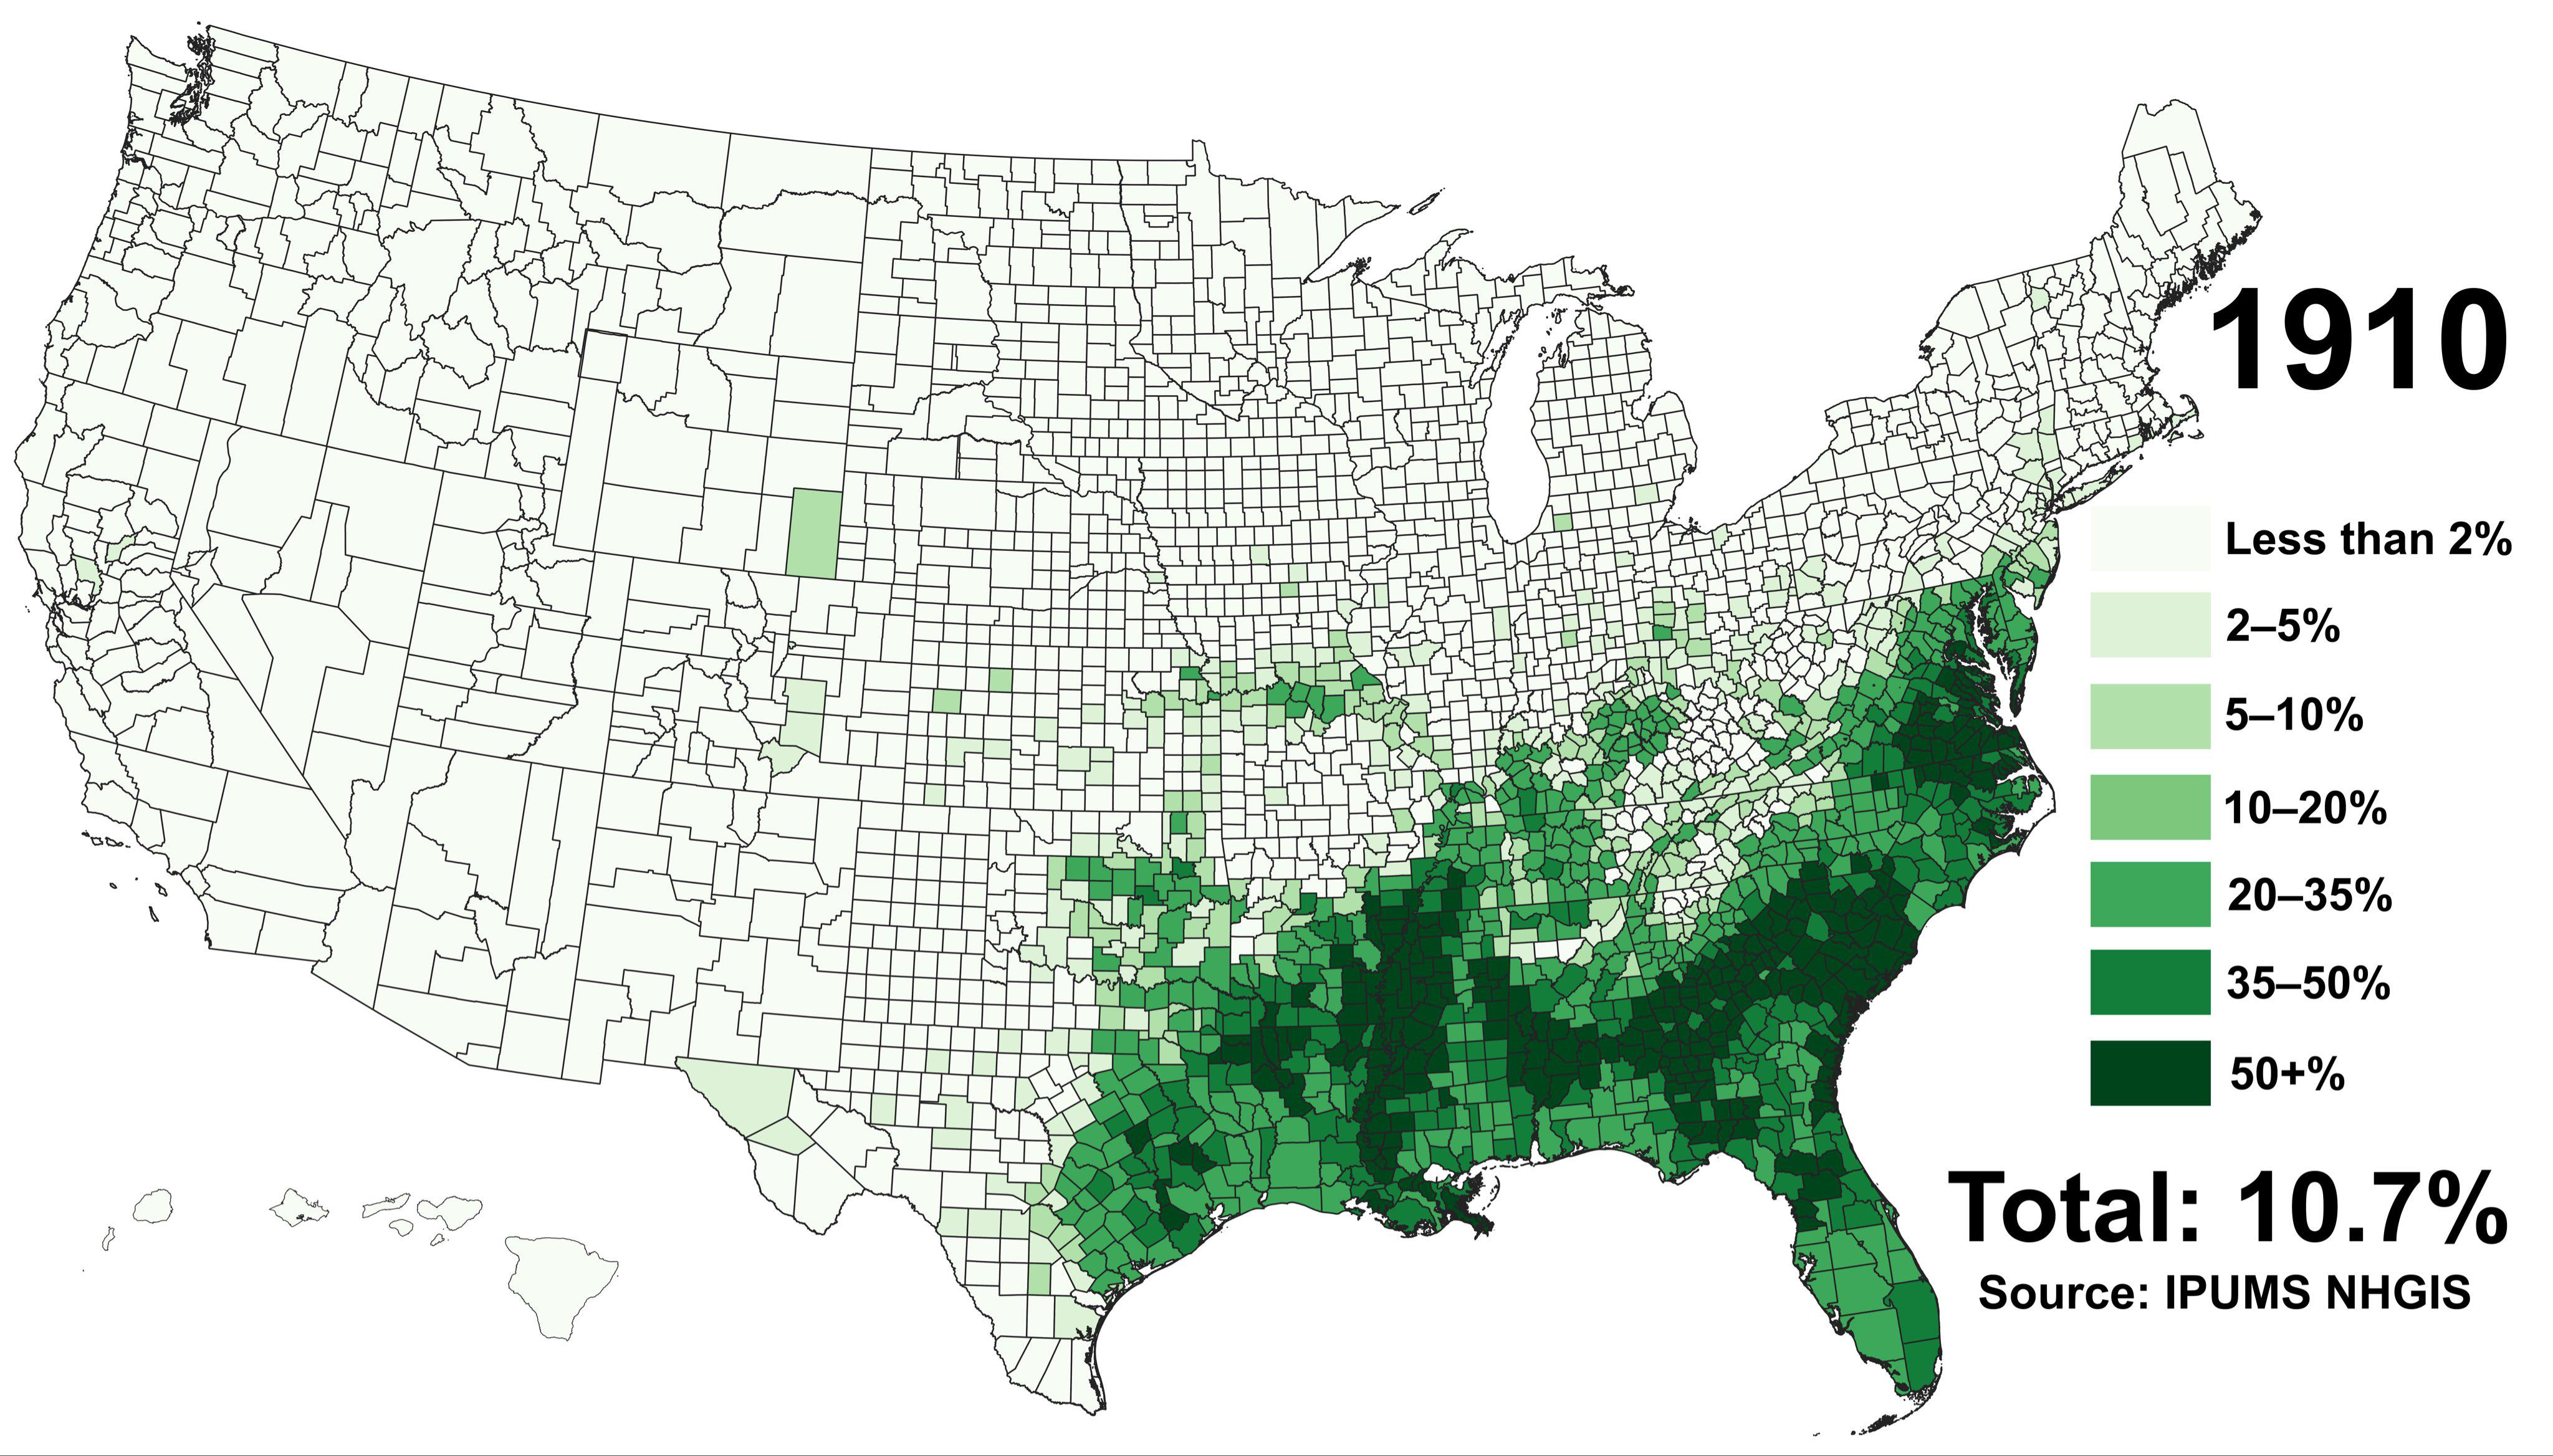
African American Population Percentage Map by County, 1910

David Chen
Data Visualization Specialist
David Chen is an expert in transforming complex geographic datasets into compelling visual narratives. He combines his background in computer science ...
Geographic Analysis
What This Map Shows\nThis map visualizes the percentage of African Americans within each U.S. county in the year 1910. It's a snapshot of demographic distribution during a pivotal time in American history, reflecting the social and economic conditions of the time. The data reveals how population densities were not only a product of demographic trends but were also shaped by historical, cultural, and political factors that influenced the lives of African Americans across the nation.
Deep Dive into African American Demographics in 1910\nIn 1910, the United States was at a crossroads, grappling with issues of race, identity, and the legacy of slavery. By this time, the African American population had begun to establish itself in various regions, particularly in the South, where the majority of the African American community resided. According to the 1910 census, there were approximately 10 million African Americans in the United States, a significant increase from previous decades.
Interestingly, the largest concentrations of African Americans were found in the Southern states. For instance, counties in Mississippi, Louisiana, and Alabama exhibited some of the highest percentages, often exceeding 80%. These areas were shaped by historical legacies of plantation economies and the aftermath of the Civil War, which left many African Americans in agricultural labor roles.
However, the map also indicates pockets of African American populations outside the South. Cities in the North, such as Chicago, Detroit, and Philadelphia, were beginning to see an influx of African Americans migrating from rural areas in search of better job opportunities and living conditions, a movement that would later be recognized as the Great Migration. In these Northern urban centers, the percentages of African Americans were notably lower than in the South, reflecting a different socio-economic landscape.
The varying percentages across the map also highlight the stark contrast between rural and urban living conditions for African Americans at the time. In rural areas dominated by agriculture, the community was often isolated and faced significant economic hardships, whereas urban centers offered new opportunities albeit with their own set of challenges, including discrimination and housing segregation.
Regional Analysis\nWhen we break down the map into specific regions, the trends become even more evident. In the Deep South, counties in Mississippi, such as Jefferson County and Claiborne County, showcased African American populations that made up more than 90% of the total population. This high percentage can be attributed to the historical reliance on plantation agriculture, which created a demographic landscape where African Americans formed the majority.
Moving to the border states, such as Kentucky and Virginia, the percentages begin to drop but still reflect significant African American communities. For instance, counties like Fayette County in Kentucky had African American populations nearing 30%. These percentages reveal the complex history of slavery and post-Civil War dynamics that influenced migration patterns and settlement.
In contrast, the Northern industrial cities were beginning to attract African Americans seeking employment. For example, while Chicago had only about 2% of its population identified as African American in 1910, this figure was starting to rise as the Great Migration gained momentum. Interestingly, this shift would lay the groundwork for the vibrant African American cultural and political movements that would emerge in the following decades.
Significance and Impact\nUnderstanding the demographic distribution of African Americans in 1910 is crucial for contextualizing the social fabric of the United States during this era. It sheds light on the systemic inequalities faced by African Americans and highlights the migration patterns that would shape future societal developments.
The implications of these demographic trends continue to resonate today. The historical migration of African Americans from rural South to urban North not only transformed American cities but also led to significant cultural movements, including the Harlem Renaissance. In contemporary discussions about race, identity, and economic opportunity, the patterns established in the early 20th century remain relevant.
Moreover, recognizing the historical context of these population distributions allows us to understand current issues related to race, socioeconomic status, and urban planning. As cities today grapple with challenges related to gentrification, community displacement, and racial equity, the data from 1910 serves as a reminder of the long-standing impacts of historical injustices.
In conclusion, the 1910 map of African Americans by county percentage is more than just a visualization; it is a historical document that captures the complexities of race and demographic shifts in the United States, revealing the legacy of the past that still influences our society today.
Visualization Details
- Published
- September 27, 2025
- Views
- 66
Comments
Loading comments...