US State Median Household Income Map

Marcus Rodriguez
Historical Geography Expert
Marcus Rodriguez specializes in historical cartography and geographic data analysis. With a background in both history and geography, he brings unique...
Geographic Analysis
What This Map Shows
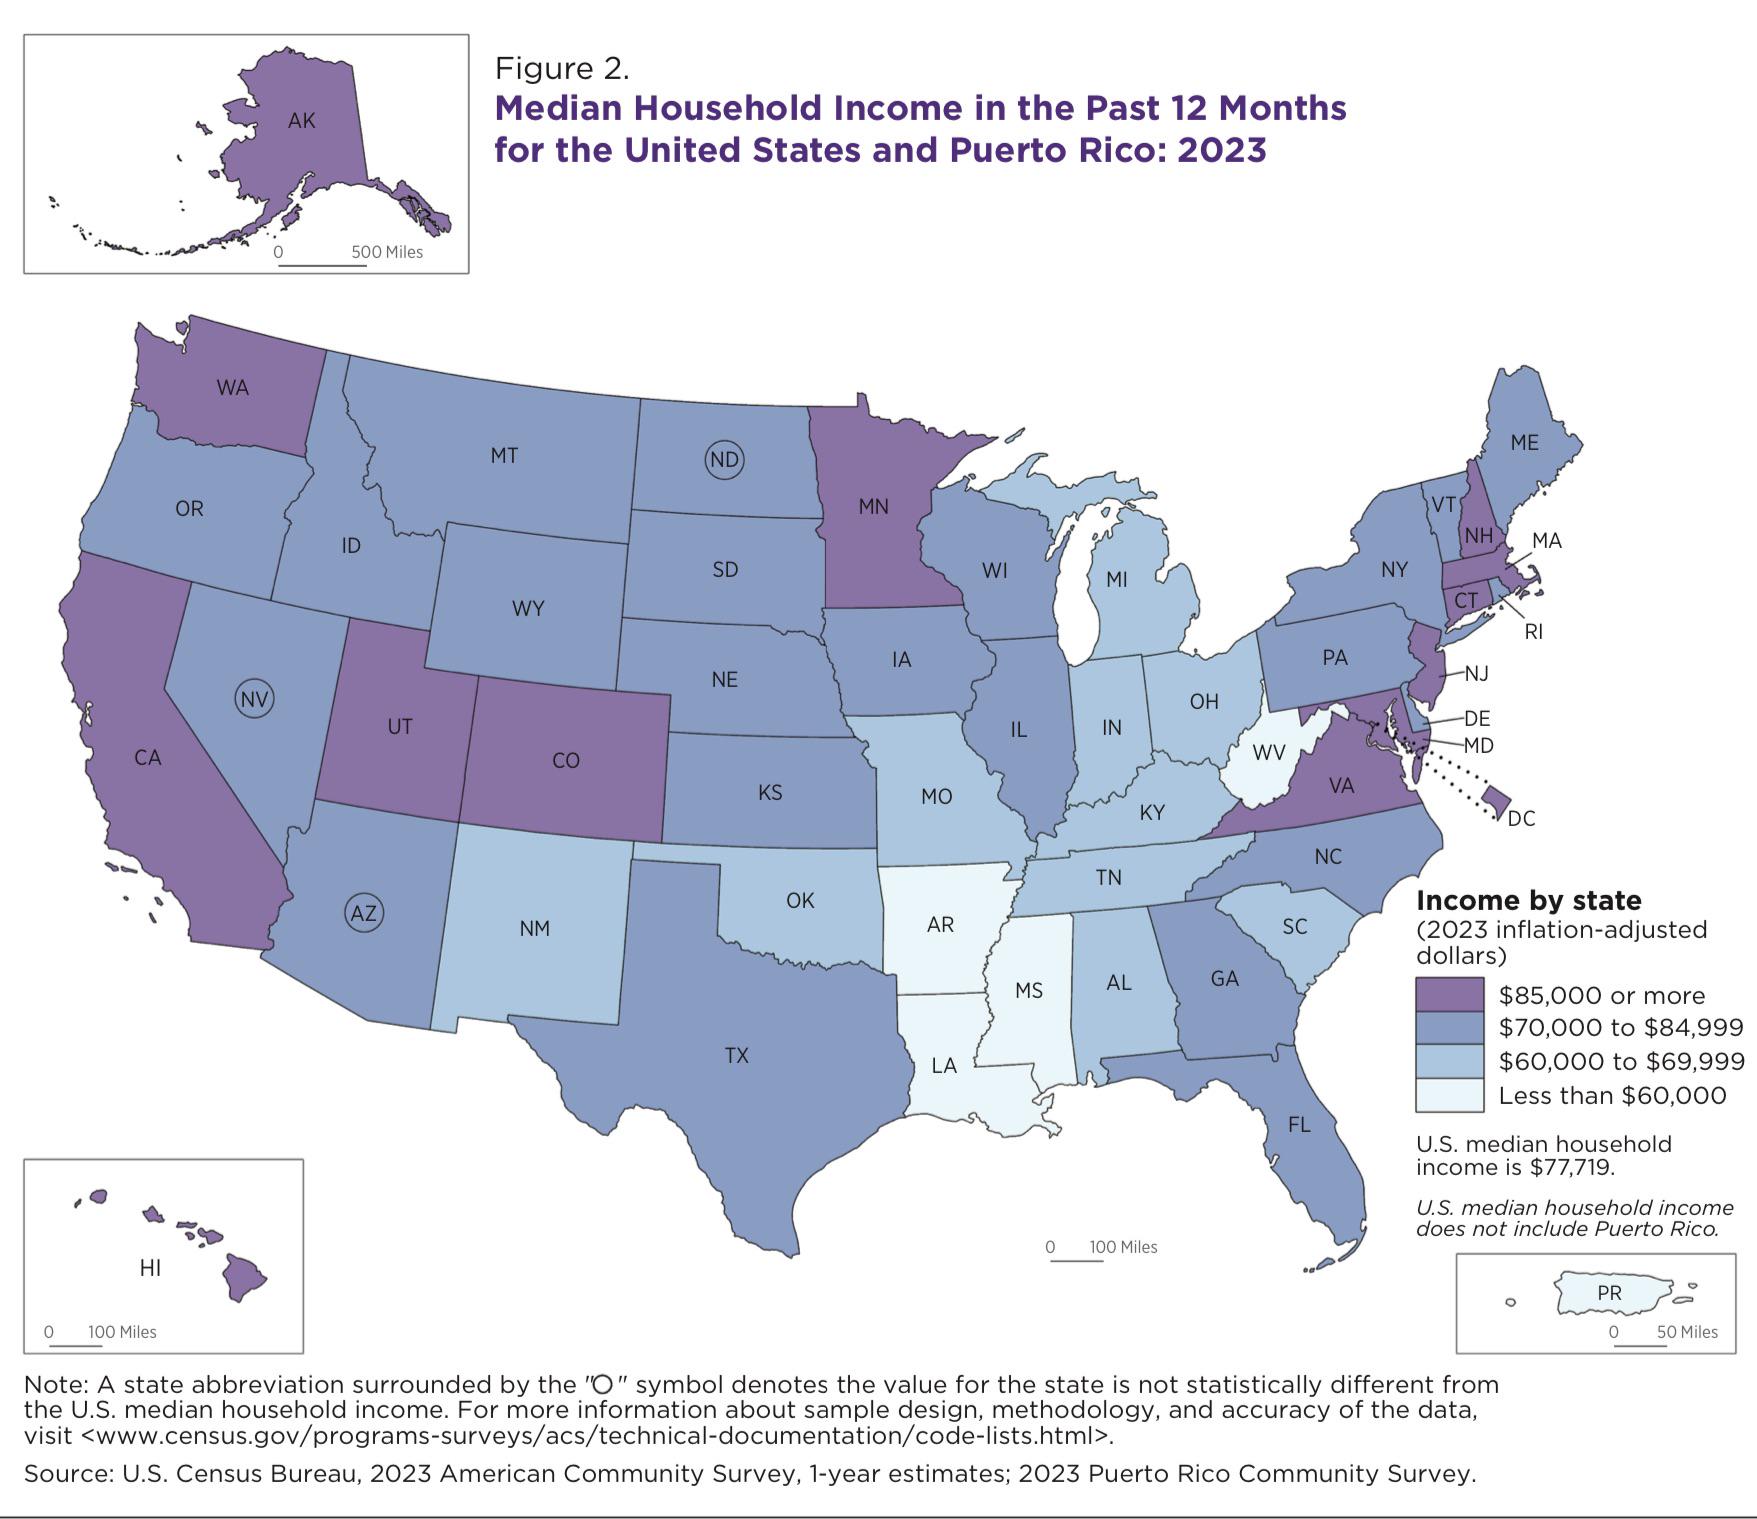
The "US State Median Household Income Map" provides a clear visual representation of the median household income across different states in the United States. This map highlights significant variations in income levels, allowing viewers to quickly grasp which states have higher or lower median incomes. Understanding income distribution is crucial, as it reflects not just the economic health of a region, but also the quality of life for its residents.
Deep Dive into Median Household Income
Median household income is a key indicator of economic well-being within a state. It represents the middle income level of households, meaning half of the households earn less and half earn more. This metric is crucial for various reasons: it influences local economies, affects housing markets, and can even impact political decisions.
Interestingly, median household income can reveal much about the socioeconomic conditions in a state. For instance, states like Maryland and New Jersey often rank at the top with median incomes exceeding $80,000, while states such as Mississippi and Arkansas typically report figures below $50,000. These disparities are influenced by factors such as industry presence, cost of living, education levels, and even historical economic trends.
Moreover, the median household income can also reflect regional economic conditions. For example, states with a strong technology sector, like California and Washington, tend to have higher median incomes due to the lucrative job opportunities in these industries. Conversely, states heavily reliant on agriculture or manufacturing may struggle to achieve similar income levels, particularly if those sectors face economic downturns or automation challenges.
An essential aspect of median household income is its relationship with poverty rates. States with lower median incomes often experience higher poverty levels, which can lead to a cycle of economic challenges. For instance, the economic struggles in Southern states often correlate with lower median incomes, suggesting that without targeted economic development initiatives, these regions may continue to lag behind.
Regional Analysis
When examining the median household income by region, noticeable patterns emerge. The Northeast generally shows higher median incomes, with states like Massachusetts and New York leading the way. This is largely attributed to the concentration of high-paying jobs in finance, technology, and healthcare.
In contrast, the South often presents a mixed picture. States like Texas and Florida boast larger median incomes driven by diverse economies, including energy and tourism. However, states in the Deep South, such as Alabama and Louisiana, still grapple with low median incomes and high poverty rates. It’s fascinating to see how regional economies can vary so dramatically within the same geographical area.
The Midwest, often considered the heartland of America, displays a more moderate range of median incomes. States like Illinois and Minnesota perform well due to a balanced mix of manufacturing, agriculture, and technology. However, states like West Virginia face challenges that pull the average down, emphasizing the importance of economic diversification.
The West Coast, with states like California and Oregon, shows a unique trend where high median incomes coexist with high living costs. This situation leads to discussions about affordability and the need for sustainable economic policies that ensure growth benefits all residents.
Significance and Impact
Understanding median household income is not just an exercise in data analysis; it has profound implications for various aspects of life. Policymakers use this information to shape legislation, allocate resources, and implement programs that aim to improve economic conditions. Moreover, businesses often look at income levels to determine where to expand or invest, impacting job creation and economic growth.
In recent years, there has been a noticeable trend towards income inequality, where the rich are getting richer, and the middle and lower classes are struggling to keep up. This trend raises important questions about social equity and economic mobility. What’s fascinating is that as we analyze these income figures, we can also infer the potential for social changes—regions with rising median incomes may indicate stronger education systems and better job opportunities, paving the way for a more prosperous future.
In conclusion, the "US State Median Household Income Map" is more than just a representation of numbers; it’s a reflection of the complex socio-economic tapestry that makes up the United States. By understanding these patterns, we can foster informed discussions on how to address income disparities and promote equitable growth for all citizens.
Visualization Details
- Published
- September 22, 2025
- Views
- 52
Comments
Loading comments...