US States Ranked by Median Household Income Map

Alex Cartwright
Senior Cartographer & GIS Specialist
Alex Cartwright is a renowned cartographer and geographic information systems specialist with over 15 years of experience in spatial analysis and data...
Geographic Analysis
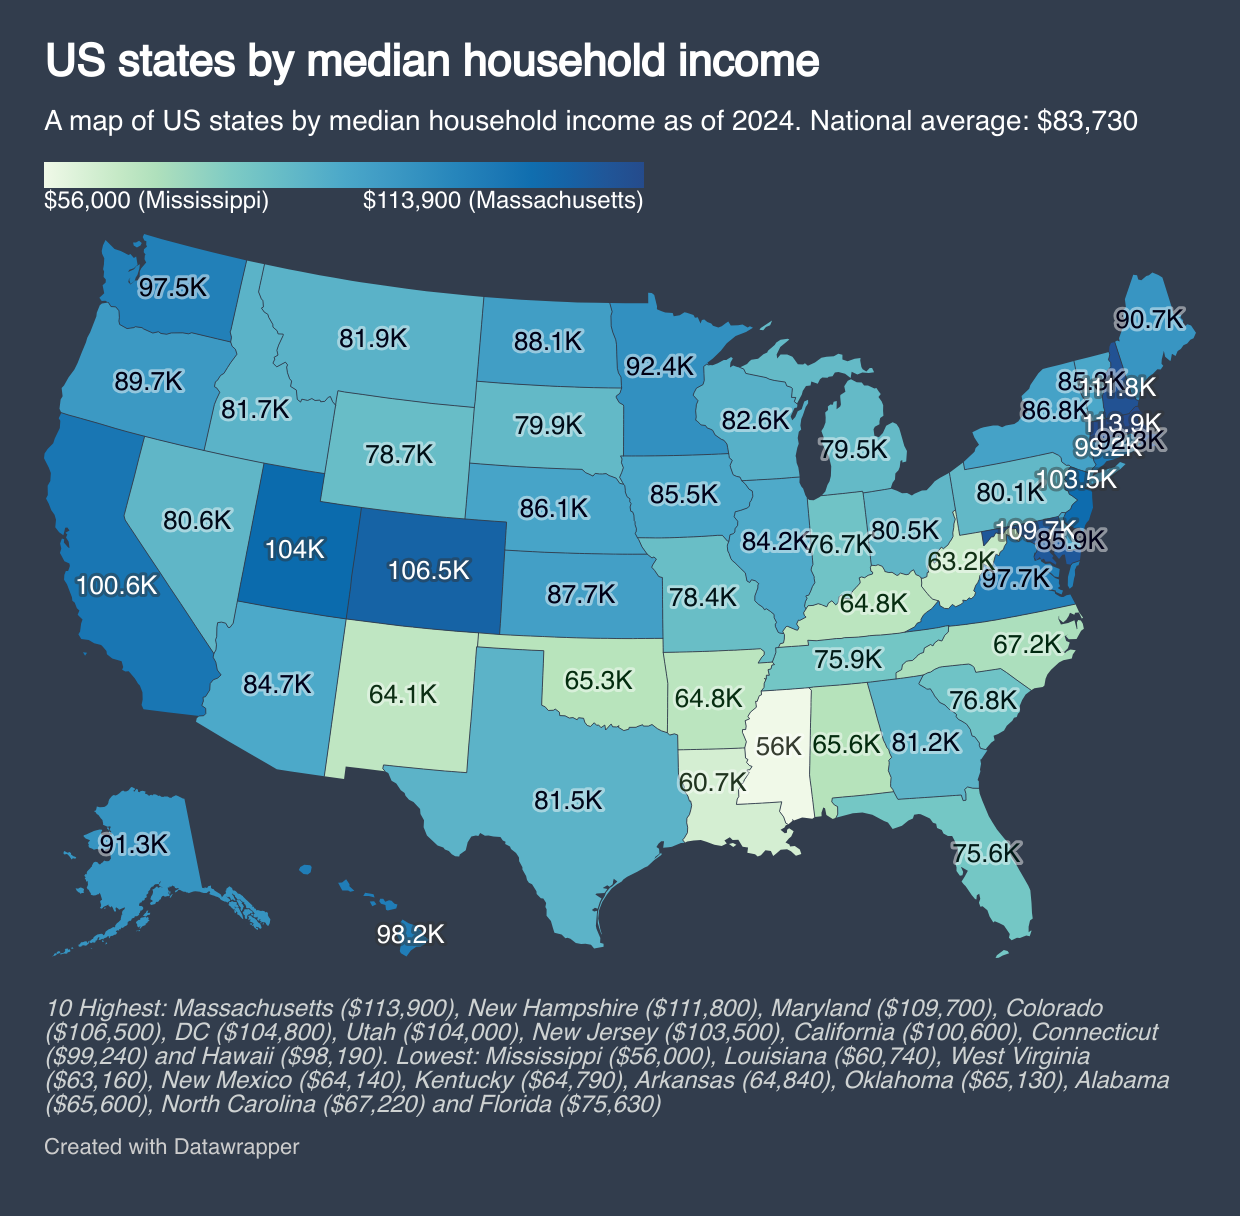
What This Map Shows
The "US States Ranked by Median Household Income Map" provides a visual representation of the median household income across the United States. This map highlights how income levels vary from state to state, revealing significant economic disparities and offering insights into the financial health of different regions. From bustling metropolitan hubs to rural communities, the map allows viewers to quickly assess how median incomes can influence quality of life, access to resources, and overall economic opportunities.
Deep Dive into Household Income
Household income is a crucial indicator of economic prosperity and social well-being. It encompasses the total income earned by all members of a household, including wages, salaries, investment income, and government benefits. In the US, median household income serves as a benchmark that helps gauge the standard of living and purchasing power of families across the nation. According to the US Census Bureau, the national median household income was approximately $70,784 in 2021, but this figure has significant variations from state to state.
Interestingly, states like Maryland and New Jersey consistently top the charts with median incomes exceeding $80,000, reflecting their robust economies often driven by high-paying industries such as technology, finance, and healthcare. Conversely, states like Mississippi and Arkansas report median incomes closer to $50,000, which can be attributed to a combination of factors including lower job availability, less diversification in the local economy, and historical socioeconomic challenges.
Moreover, the economic landscape of a state can also be influenced by its geographic location, education levels, infrastructure, and job market conditions. For example, states on the coasts, like California and New York, tend to have higher living costs that drive up income levels. However, this also creates a paradox where, despite earning higher wages, many residents struggle with affordability in housing, education, and healthcare.
What's fascinating is how median household income can reflect not only economic conditions but also social issues such as poverty rates, access to healthcare, and educational attainment. Areas with higher median incomes often correlate with better access to quality education and health services, leading to a cycle of prosperity that can be challenging to break in lower-income states. It's a stark reminder of how income disparities can perpetuate systemic inequalities.
Regional Analysis
Analyzing the map reveals distinct regional trends in median household income. The Northeast, for instance, showcases several high-income states, with Massachusetts and Connecticut leading the pack. This region benefits from a concentration of prestigious universities and research institutions that fuel innovation and attract a skilled workforce.
In contrast, the South presents a mixed bag. States like Virginia and Texas demonstrate higher median incomes, driven by diverse economies that include technology, defense, and energy sectors. However, neighboring states such as Alabama and Louisiana lag behind, often due to historical economic challenges and lower educational attainment levels among the workforce.
The Midwest generally shows moderate household income levels, with states like Illinois and Minnesota performing well due to strong agricultural sectors and manufacturing bases. However, states like West Virginia continue to struggle, facing economic stagnation as traditional industries have declined.
Lastly, the West is characterized by a significant income range. While California boasts some of the highest median incomes thanks to its tech industry, states like New Mexico experience lower income levels. This disparity highlights how different regional economies can thrive or falter based on industry presence and investment.
Significance and Impact
Understanding median household income is vital for policymakers, businesses, and residents alike. It influences everything from housing policies to economic development strategies. For instance, states with lower median incomes may require targeted investments in education, infrastructure, and job training programs to uplift their economies.
Furthermore, as the nation grapples with issues like income inequality and economic mobility, these income statistics provide a lens through which we can assess progress (or lack thereof). Current trends point towards increasing income disparities, with wealth concentrating in urban centers while rural areas struggle to keep pace. This could have long-term implications for community development and social cohesion.
As we look to the future, it’s important to monitor these trends closely. Will remote work create new opportunities for lower-income areas? How will changes in the global economy impact local job markets? The answers to these questions will be crucial as we strive to create a more equitable economic landscape.
In conclusion, the map of US states ranked by median household income is more than just a collection of numbers; it tells a story about our nation's economic health, challenges, and opportunities. Engaging with this data can empower individuals and leaders to make informed decisions that shape the future of communities across the country.
Visualization Details
- Published
- September 10, 2025
- Views
- 88
Comments
Loading comments...