Auto Debt in US Map

Marcus Rodriguez
Historical Geography Expert
Marcus Rodriguez specializes in historical cartography and geographic data analysis. With a background in both history and geography, he brings unique...
Geographic Analysis
What This Map Shows
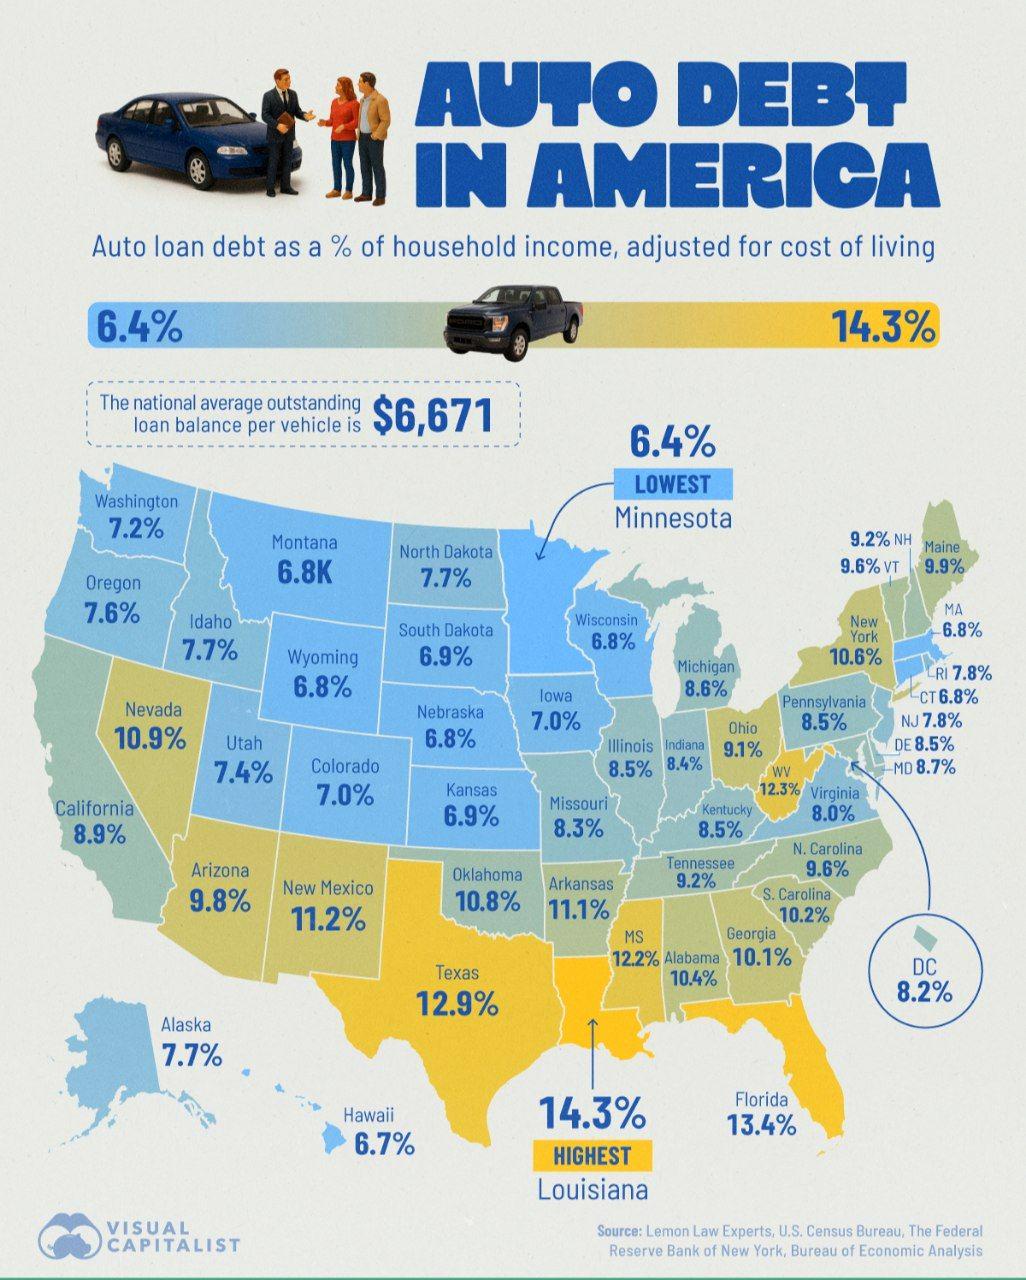
The "Auto Debt in US Map" provides a comprehensive visualization of the outstanding automotive debt across various states in the United States. By displaying the total amount of auto loans per state, this map illustrates the financial burden that car ownership places on American families. Auto debt has become a significant aspect of personal finance, reflecting not only the economic health of households but also the broader financial landscape of the country.
Deep Dive into Auto Debt
Auto debt, or the total amount of money owed on car loans, has been escalating in the United States for several years. As of 2023, this figure surpassed a staggering $1.4 trillion, showcasing a trend that has raised concerns among economists and policymakers alike. Interestingly, the rise in auto debt is influenced by several factors, including the increasing cost of vehicles, the availability of credit, and the desire for consumers to own newer models with advanced technology.
One of the most notable aspects of auto debt is its correlation with the overall economic conditions of the country. For instance, when unemployment rates are low and wages are rising, people are more inclined to take on larger loans for vehicles. Conversely, in times of economic uncertainty, such as during a recession, auto debt can become a heavy burden for many families. The average loan amount for a new car has reached approximately $37,000, with many borrowers extending their repayment terms to 72 months or longer.
Moreover, the disparity in auto debt can be seen across different demographics. Studies indicate that younger generations, especially millennials and Gen Z, are more likely to have outstanding auto loans compared to older generations. This trend raises questions: Ever wondered why younger individuals are taking on more debt for vehicles? A combination of higher vehicle prices and a competitive job market pushing for mobility has made car ownership essential for many.
Additionally, the proliferation of subprime lending has played a significant role in the increase of auto debt. Subprime loans, which are extended to borrowers with lower credit scores, often come with higher interest rates and terms that can lead to greater financial strain over time. It's important to note that while these loans can help individuals acquire vehicles, they can also trap borrowers in cycles of debt.
Regional Analysis
When examining the map, noticeable variations emerge across different regions of the United States. For example, states like Texas and California show some of the highest levels of auto debt, attributed to their large populations and a culture that heavily relies on personal vehicles. In Texas, the average outstanding auto loan is approximately $21,000, reflecting the state's booming economy and the demand for larger vehicles like trucks and SUVs.
On the other hand, states in the Northeast, such as New York and Massachusetts, tend to have lower average auto debt. This can be attributed to a combination of factors including higher public transportation accessibility and a more urban lifestyle that diminishes the necessity for car ownership. Interestingly, states with fewer urban centers, such as Wyoming and Montana, exhibit higher auto debt levels. Here, the lack of reliable public transport options drives residents to depend on their vehicles, prompting them to take on larger loans.
Furthermore, the map highlights that regions with high auto debt often overlap with those experiencing economic growth, as seen in the Sun Belt states. However, this correlation raises concerns about sustainability. If economic conditions shift, residents in these areas may find themselves struggling under the weight of their auto loans.
Significance and Impact
Understanding auto debt is critical in today's economic climate. With the average American household spending a significant portion of their income on car payments, this debt influences not just personal financial health, but also broader economic stability. High levels of auto debt can lead to increased rates of defaults, negatively impacting credit scores and limiting future borrowing potential for families.
Moreover, as technology evolves and electric vehicles become more prevalent, the landscape of auto debt may shift. Will consumers continue to take on high loans for these new models? Or will the push for sustainability and better financing options lead to a more prudent approach towards auto purchases? These questions are pivotal as we move forward, especially given the rising interest rates that could affect loan accessibility and affordability.
In conclusion, the "Auto Debt in US Map" serves as a crucial tool for understanding the financial habits of Americans in relation to car ownership. By analyzing the data, we can gain insights into the broader economic implications and the personal challenges many face in managing their auto loans. This map not only reflects current trends but also invites us to consider the future of automotive financing in a rapidly changing world.
Visualization Details
- Published
- September 1, 2025
- Views
- 96
Comments
Loading comments...