Largest Hispanic Ethnic Groups in the USA Map

Marcus Rodriguez
Historical Geography Expert
Marcus Rodriguez specializes in historical cartography and geographic data analysis. With a background in both history and geography, he brings unique...
Geographic Analysis
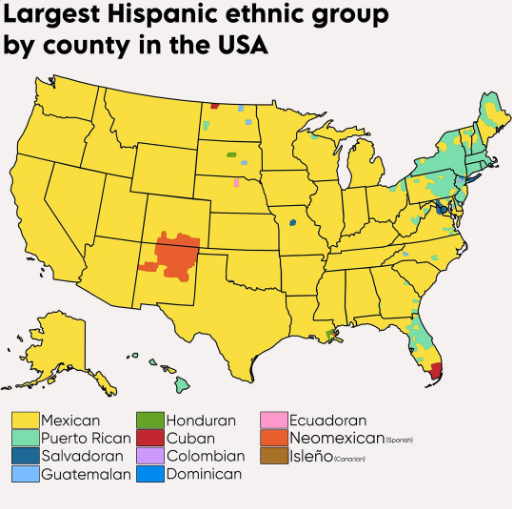
What This Map Shows\nThis map illustrates the distribution of the largest Hispanic ethnic groups across the United States, highlighting where these communities are concentrated. It provides a visual representation of the diverse Hispanic populations, including Mexican, Puerto Rican, Cuban, and others. By examining this map, we can gain insights into the demographic patterns that shape American society today.
Deep Dive into Hispanic Ethnic Groups\nThe Hispanic community in the United States is incredibly diverse, comprising various ethnicities, languages, and cultural backgrounds. As of the latest census data, there are approximately 62 million Hispanic or Latino individuals in the U.S., making up around 18% of the total population. Among these, Mexican Americans represent the largest group, accounting for approximately 62% of the Hispanic population. What's fascinating is that this demographic is not just concentrated in traditional areas like California and Texas; significant populations can also be found in states like Illinois and New York.
Puerto Ricans form the second-largest group, primarily found in the Northeast, particularly in New York and New Jersey, while Cubans are predominantly located in Florida, especially in Miami-Dade County. Other Hispanic groups, such as Dominicans and Salvadorans, have also seen substantial growth, contributing to the rich tapestry of cultures across the U.S.
Interestingly, the reasons behind these population distributions can be traced back to historical migration patterns, economic opportunities, and social networks. Many Mexican immigrants have settled in the Southwest due to proximity and labor demands, especially in agriculture and construction. In contrast, Puerto Ricans, being U.S. citizens by birth, have migrated to mainland states in search of better job prospects and living conditions.
Regional Analysis\nWhen we analyze the map regionally, we notice distinct areas of concentration for different Hispanic groups. For example, in the West, particularly California, the Mexican population is overwhelming. Cities like Los Angeles and San Diego are hubs for Mexican culture, evident in everything from food to festivals. In Texas, the Hispanic population is also primarily Mexican, but the state’s unique history and border with Mexico create a rich blend of cultures.
In the Northeast, New York City stands out as a melting pot of Hispanic ethnicities, with a significant Puerto Rican community alongside Dominicans and Mexicans. This region's urban environment has allowed for a vibrant Hispanic culture to flourish, influencing everything from music to cuisine. Meanwhile, in Florida, the Cuban population significantly shapes local culture, especially in Miami, where the influence of Cuban Americans is palpable in the arts, business, and politics.
In the Midwest, states like Illinois, particularly Chicago, are home to growing Mexican and Puerto Rican populations, reflecting a shift in migration patterns as individuals seek new economic opportunities.
Significance and Impact\nUnderstanding the distribution of Hispanic ethnic groups in the U.S. is crucial for several reasons. First, it helps policymakers and community leaders develop targeted initiatives that address the unique needs of these populations, such as education, healthcare, and employment services. As the Hispanic community continues to grow, its influence on the economy, culture, and politics of the United States will only become more pronounced.
Current trends suggest that the Hispanic population is on a trajectory of continued growth, driven by both immigration and higher birth rates compared to other demographic groups. The younger demographic profile of Hispanics positions them to play a critical role in the future labor market. However, challenges such as language barriers and access to education remain significant hurdles that need to be addressed.
In conclusion, the map of the largest Hispanic ethnic groups in the USA not only provides a visual representation of demographic patterns but also opens up discussions about cultural identity, migration, and the evolving landscape of American society. As we look toward the future, it’s essential to recognize and embrace the contributions of Hispanic communities to the broader American narrative.
Visualization Details
- Published
- August 14, 2025
- Views
- 90
Comments
Loading comments...