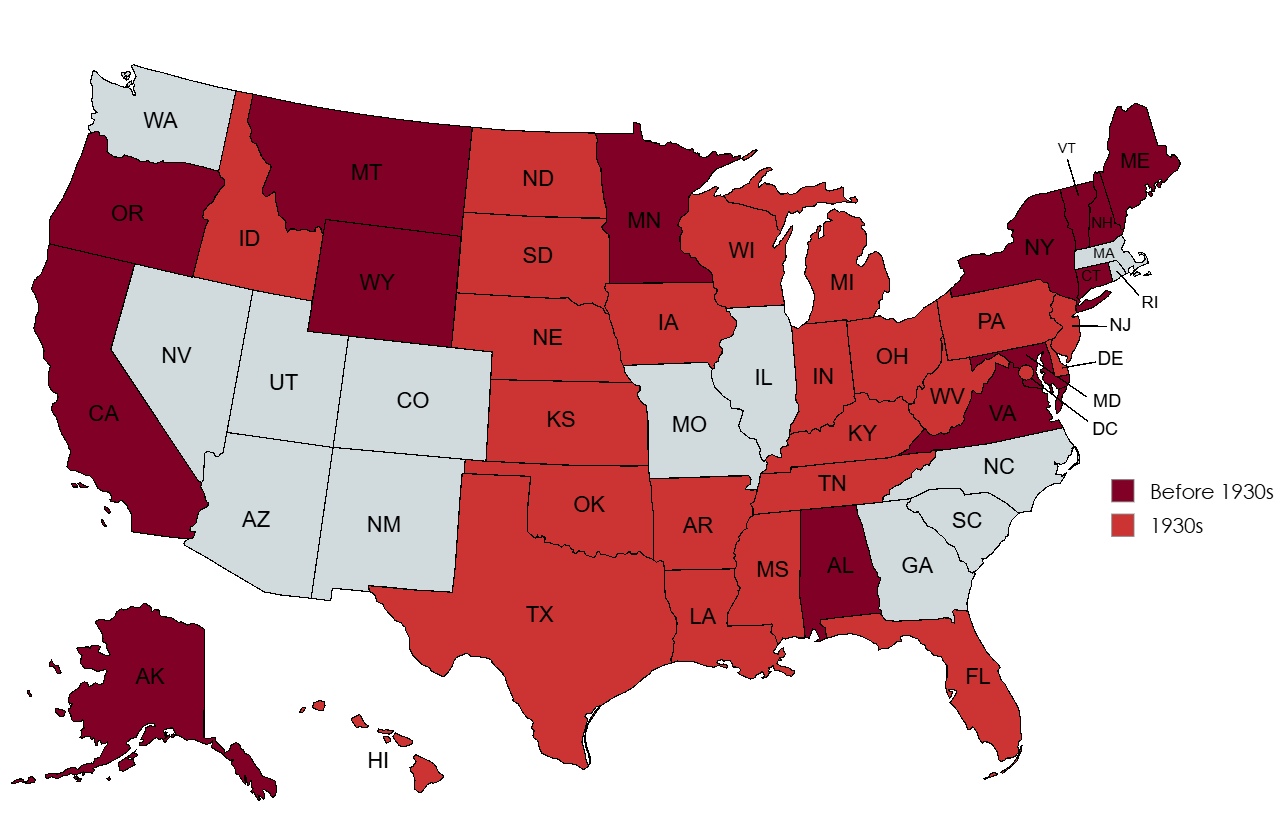
Map of US States with Record High Temperatures Before 1930s

Marcus Rodriguez
Historical Geography Expert
Marcus Rodriguez specializes in historical cartography and geographic data analysis. With a background in both history and geography, he brings unique...
Geographic Analysis
What This Map Shows
This map highlights the U.S. states that recorded their all-time high temperatures during the 1930s or earlier. It's a fascinating look at how extreme weather events shaped the climate history of the United States. Interestingly, while many of these peaks were reached during the infamous Dust Bowl years of the 1930s, some states like Montana and Maryland actually tied their all-time highs during that decade, which adds a layer of complexity to the understanding of temperature extremes in U.S. history.
Deep Dive into Historical Temperature Records
Historical temperature records are crucial for understanding climate patterns over the decades. The 1930s were particularly notable for their extreme heat, largely due to a combination of natural climatic variability and human influences such as land use changes. The Dust Bowl, a period of severe drought that affected the Great Plains, was compounded by poor agricultural practices that led to soil erosion and dust storms. This not only raised temperatures but also created a public awareness about climate change and its effects.
The highest recorded temperature in the United States is 134°F, observed in Furnace Creek Ranch, California, on July 10, 1913. However, numerous states recorded their highest temperatures in the 1930s, reflecting an era of unprecedented heatwaves. Arizona, for instance, saw its all-time record high of 128°F in 1937, while Texas reported a scorching 120°F in 1936. These states' extreme temperatures are indicative of the larger climatic conditions experienced across the nation during that decade.
The 1930s were not just about heat; they were also marked by significant shifts in weather patterns. Many experts believe that the human factor, such as the agricultural practices of the time, played a role in exacerbating the natural climate variability. As farmers plowed the grasslands, they removed the protective vegetation that helped retain moisture in the soil, leading to both drought and rising temperatures. This notion of anthropogenic climate influence is still relevant today as we look at modern climate change.
Interestingly, the records set during this time still stand in many states, indicating that the climate has not returned to those extremes despite fluctuations in weather patterns. This persistence of historical records offers a sobering reminder of the potential for extreme weather events in our current climate.
Regional Analysis
When analyzing the states shown on the map, regional variations in temperature records become evident. The Southwest, particularly Arizona and New Mexico, has consistently been among the hottest in the country, reflecting its arid desert climate. On the other hand, states in the Northeast, such as Maryland, which tied its all-time high of 109°F in 1936, show that extreme heat is not limited to traditionally hot regions.
The Midwest also offers a compelling case, with states like Nebraska and Kansas registering high temperatures during the 1930s. Interestingly, this area's climate is characterized by a mix of humid continental and steppe climates, leading to variations in how heat is felt across different locations.
In contrast, states like Montana, which saw its record high tie during the 1930s, exemplify the more temperate and variable climates of the northern U.S. Despite being far from the historical heat records of the southern states, Montana’s extreme temperatures highlight that heatwaves are not solely confined to desert regions.
Significance and Impact
Understanding the historical temperature records of U.S. states is vital for several reasons. Firstly, these records serve as a baseline for evaluating current climate trends. With global temperatures rising, analyzing past extremes helps scientists and policymakers make informed decisions about future climate resilience strategies.
Moreover, this map and its underlying data highlight the importance of recognizing regional vulnerabilities to climate change. States with historical records of extreme temperatures may be more susceptible to heatwaves, drought, and other climate-related events as our planet continues to warm. This knowledge can inform agricultural practices, water resource management, and emergency preparedness plans.
As climate change continues to influence weather patterns, it’s essential to reflect on the past to understand our future. Ever wondered how these historical highs might compare to what we could see in the coming decades? The answer could redefine our approach to managing our environment and resources effectively. The 1930s serve as a stark reminder of the extremes that can occur and the importance of preparedness in the face of a changing climate.
Visualization Details
- Published
- August 14, 2025
- Views
- 100
Comments
Loading comments...