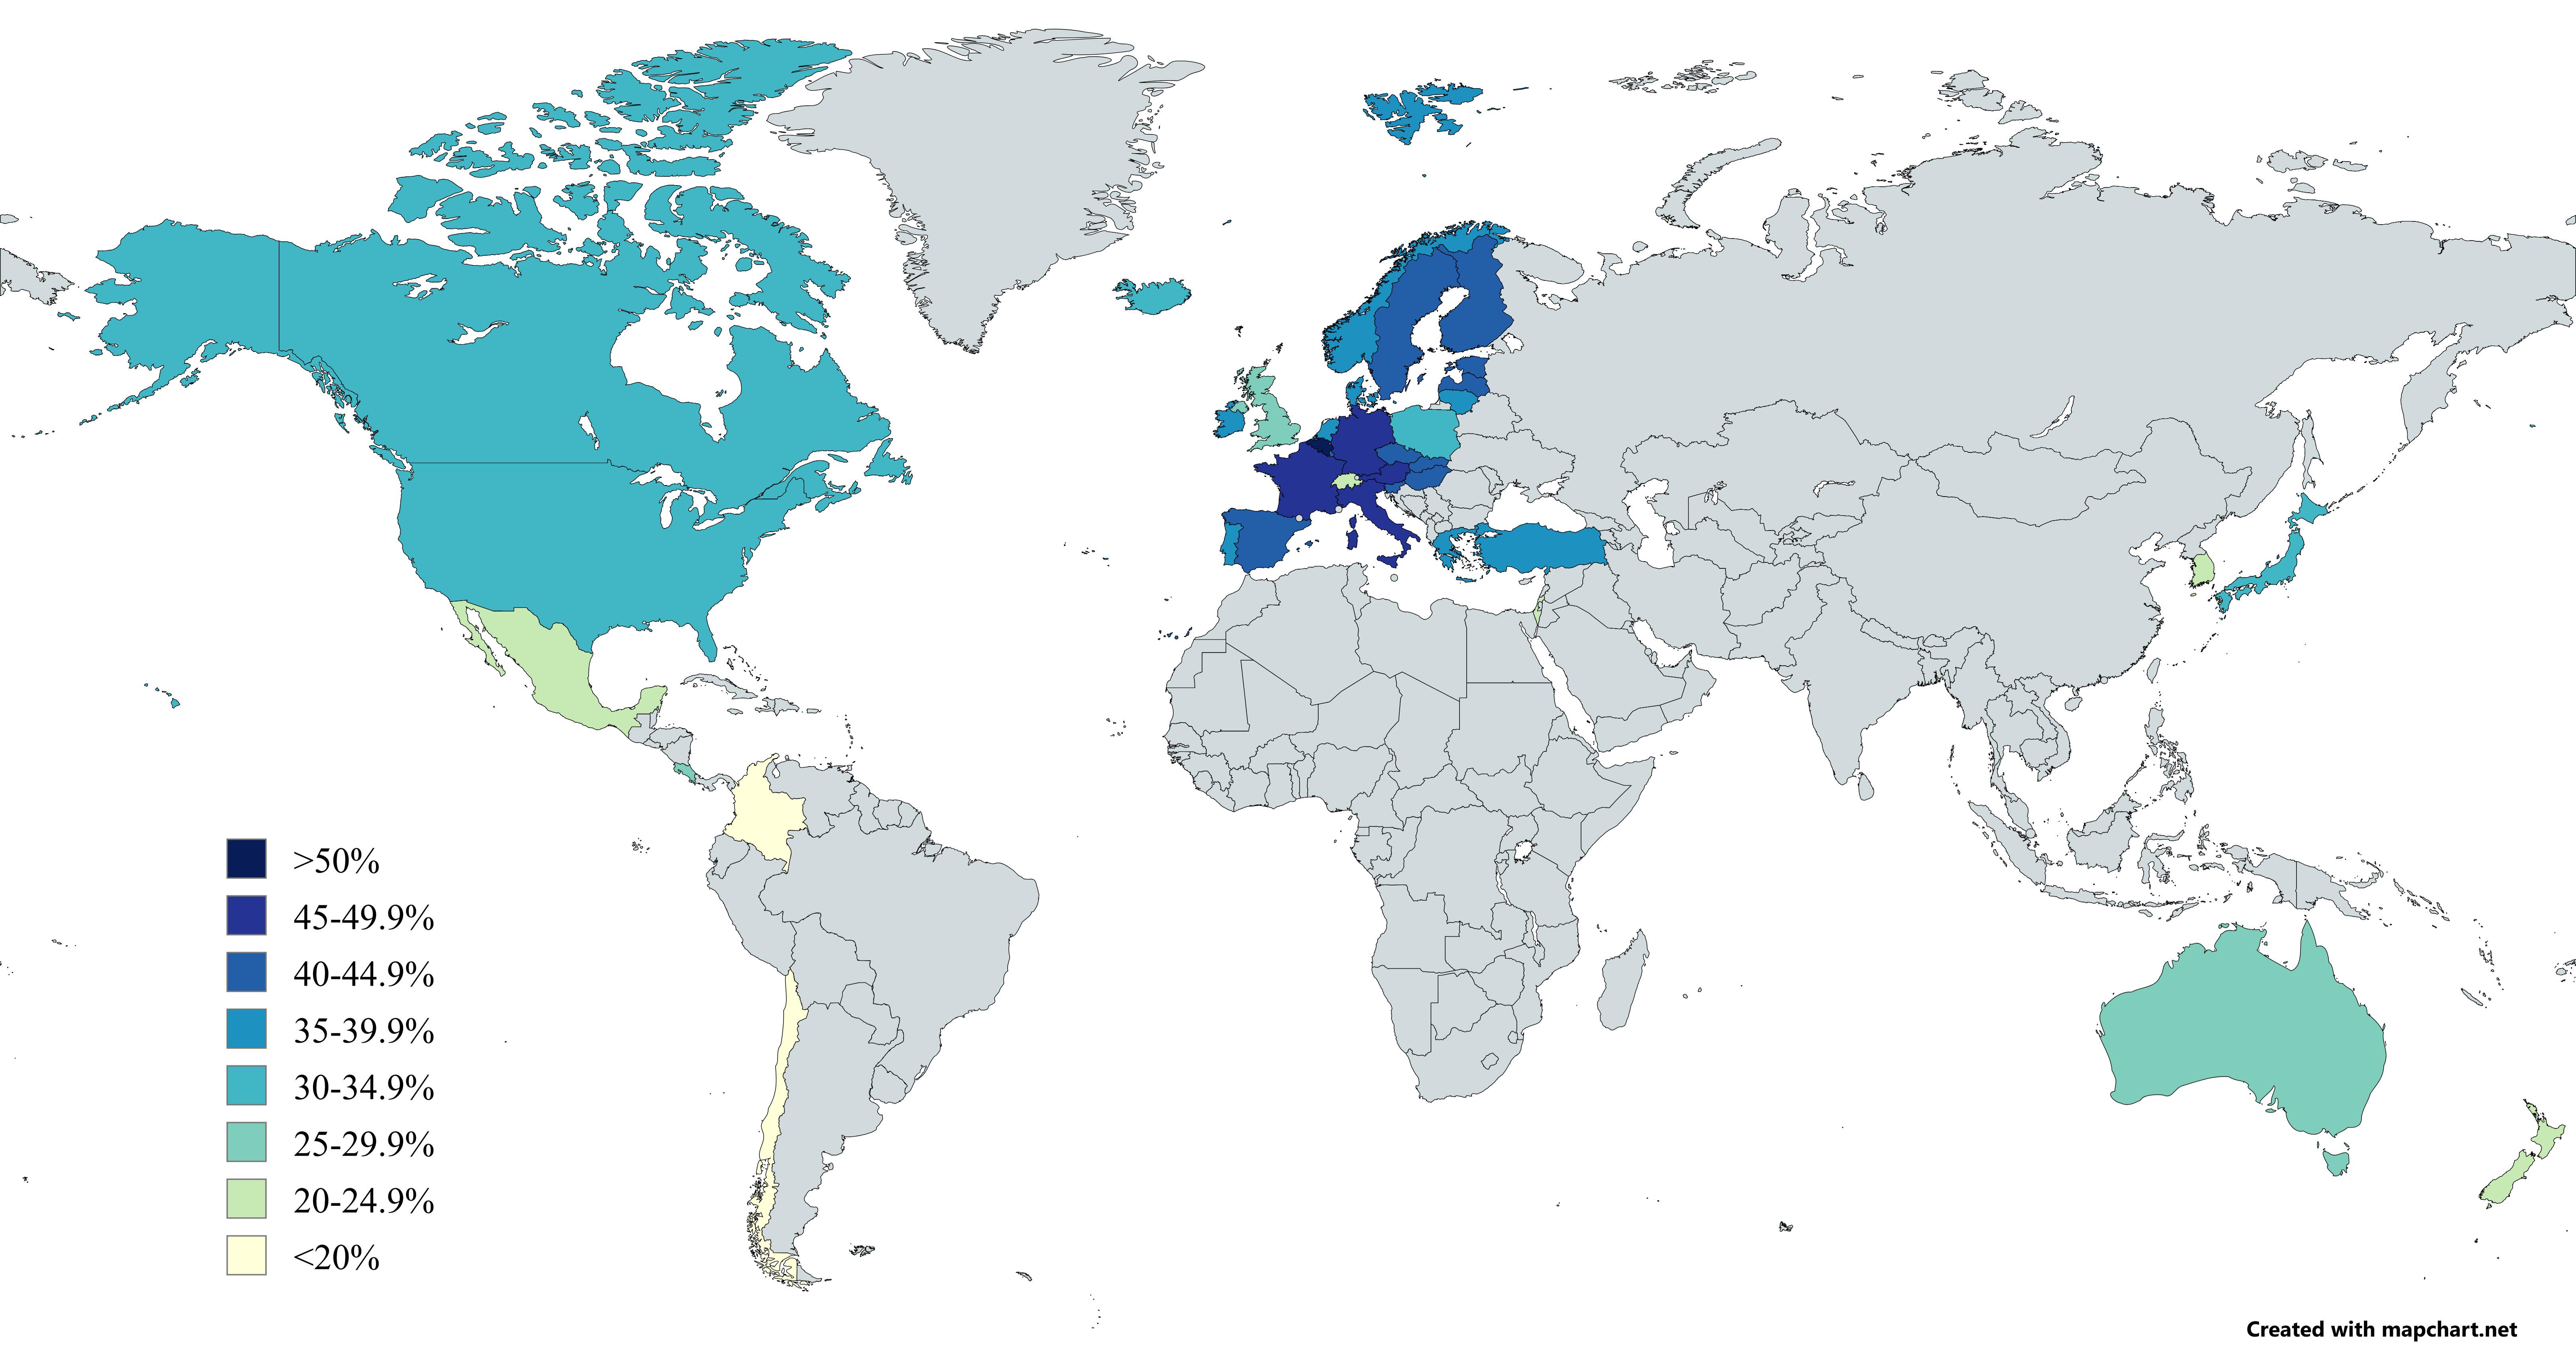
Map of Countries by Total Tax Wedge for Average Worker


Marcus Rodriguez
Historical Geography Expert
Marcus Rodriguez specializes in historical cartography and geographic data analysis. With a background in both history and geography, he brings unique...
Geographic Analysis
What This Map Shows
The "Map of Countries by Total Tax Wedge for Average Worker" visualizes the percentage of income that workers lose to taxes and social security contributions across various countries. This tax wedge is a crucial indicator, as it illustrates the extent to which taxation impacts disposable income, ultimately shaping economic behavior, workforce participation, and individual financial well-being. By highlighting disparities in tax burdens globally, this map allows viewers to quickly grasp how different nations prioritize taxation and social welfare.
Deep Dive into Total Tax Wedge
The concept of the tax wedge is essential for understanding the relationship between taxation and labor market dynamics. Essentially, the tax wedge refers to the difference between what employers pay in labor costs and what employees receive in net income. This difference can significantly influence work incentives, business investment, and overall economic health.
Interestingly, high tax wedges can deter employment, as they reduce the net income workers take home. Countries with high tax burdens often have robust social welfare systems that aim to provide extensive public services like healthcare, education, and social security. For instance, Scandinavian nations like Sweden and Denmark are known for their high tax wedges, which can exceed 40%. However, these countries also rank high in quality of life and social equity due to their comprehensive public services and social safety nets.
Conversely, countries with lower tax wedges, such as the United States and some Eastern European nations, may encourage higher disposable incomes, which can stimulate consumer spending and business growth. However, a lower tax wedge can also indicate fewer public services and social safety nets, potentially leading to increased inequality and less support for the vulnerable.
According to the OECD report, the average tax wedge for an average worker in 2021 stood at around 34%, with considerable variations across member countries. Countries like Belgium and France consistently rank at the top of the list, showcasing tax wedges of 54% and 49% respectively. This substantial taxation reflects these nations' commitments to social welfare but also raises questions about work incentives and economic productivity.
Additionally, the tax wedge can be influenced by various factors, including the structure of the labor market, the level of government spending, and the intricacies of tax policy. Countries are increasingly assessing their tax policies to balance the need for revenue against the desire to stimulate economic activity and job creation. What’s fascinating is how nations are experimenting with different tax structures to find an optimal balance that suits their unique socio-economic landscapes.
Regional Analysis
Breaking down the map regionally reveals intriguing patterns. In Europe, for instance, countries in the north tend to exhibit higher tax wedges compared to southern nations. For example, Sweden and Denmark dominate the high end of the spectrum, while countries like Greece and Portugal show lower tax burdens, reflecting different approaches to taxation and social spending.
In North America, the United States has a notably lower tax wedge, around 30%, when compared to Canada, which stands at approximately 34%. This discrepancy can be attributed to varying public policies regarding healthcare and social welfare. Interestingly, Canada invests more heavily in public healthcare, which is funded through higher taxes, while the U.S. relies more on private healthcare solutions, leading to lower overall tax burdens for individuals.
Looking at Asia, Japan showcases a moderate tax wedge, while countries like Singapore exhibit a low tax burden, enticing businesses and expatriates with favorable tax conditions. This divergence highlights how tax policy can reflect broader economic strategies, such as attracting foreign investment or maintaining social welfare.
Significance and Impact
Understanding the total tax wedge is crucial because it directly affects economic behavior and societal well-being. A high tax wedge can discourage work and investment, but it can also provide a safety net that supports the most vulnerable populations. As governments worldwide grapple with the repercussions of economic crises, COVID-19 recovery, and changing demographics, the tax wedge will undoubtedly be a focal point in policy discussions.
Moreover, as work patterns evolve, particularly with the rise of gig economies and remote work, countries may need to rethink their approaches to taxation. Ever wondered why some nations are moving towards flat tax systems or tax incentives for specific sectors? It’s all about adapting to the changing landscape of labor and ensuring that economic growth is sustainable and inclusive.
In conclusion, this map not only illustrates the varying tax burdens across countries but also serves as a reflection of broader societal values and priorities. As we move forward, understanding these dynamics will be crucial for shaping future tax policies and their implications on economic resilience and social equity.
Visualization Details
- Published
- August 12, 2025
- Views
- 136
Comments
Loading comments...