Largest Asian Racial Subgroup by County Map

Alex Cartwright
Senior Cartographer & GIS Specialist
Alex Cartwright is a renowned cartographer and geographic information systems specialist with over 15 years of experience in spatial analysis and data...
Geographic Analysis
What This Map Shows
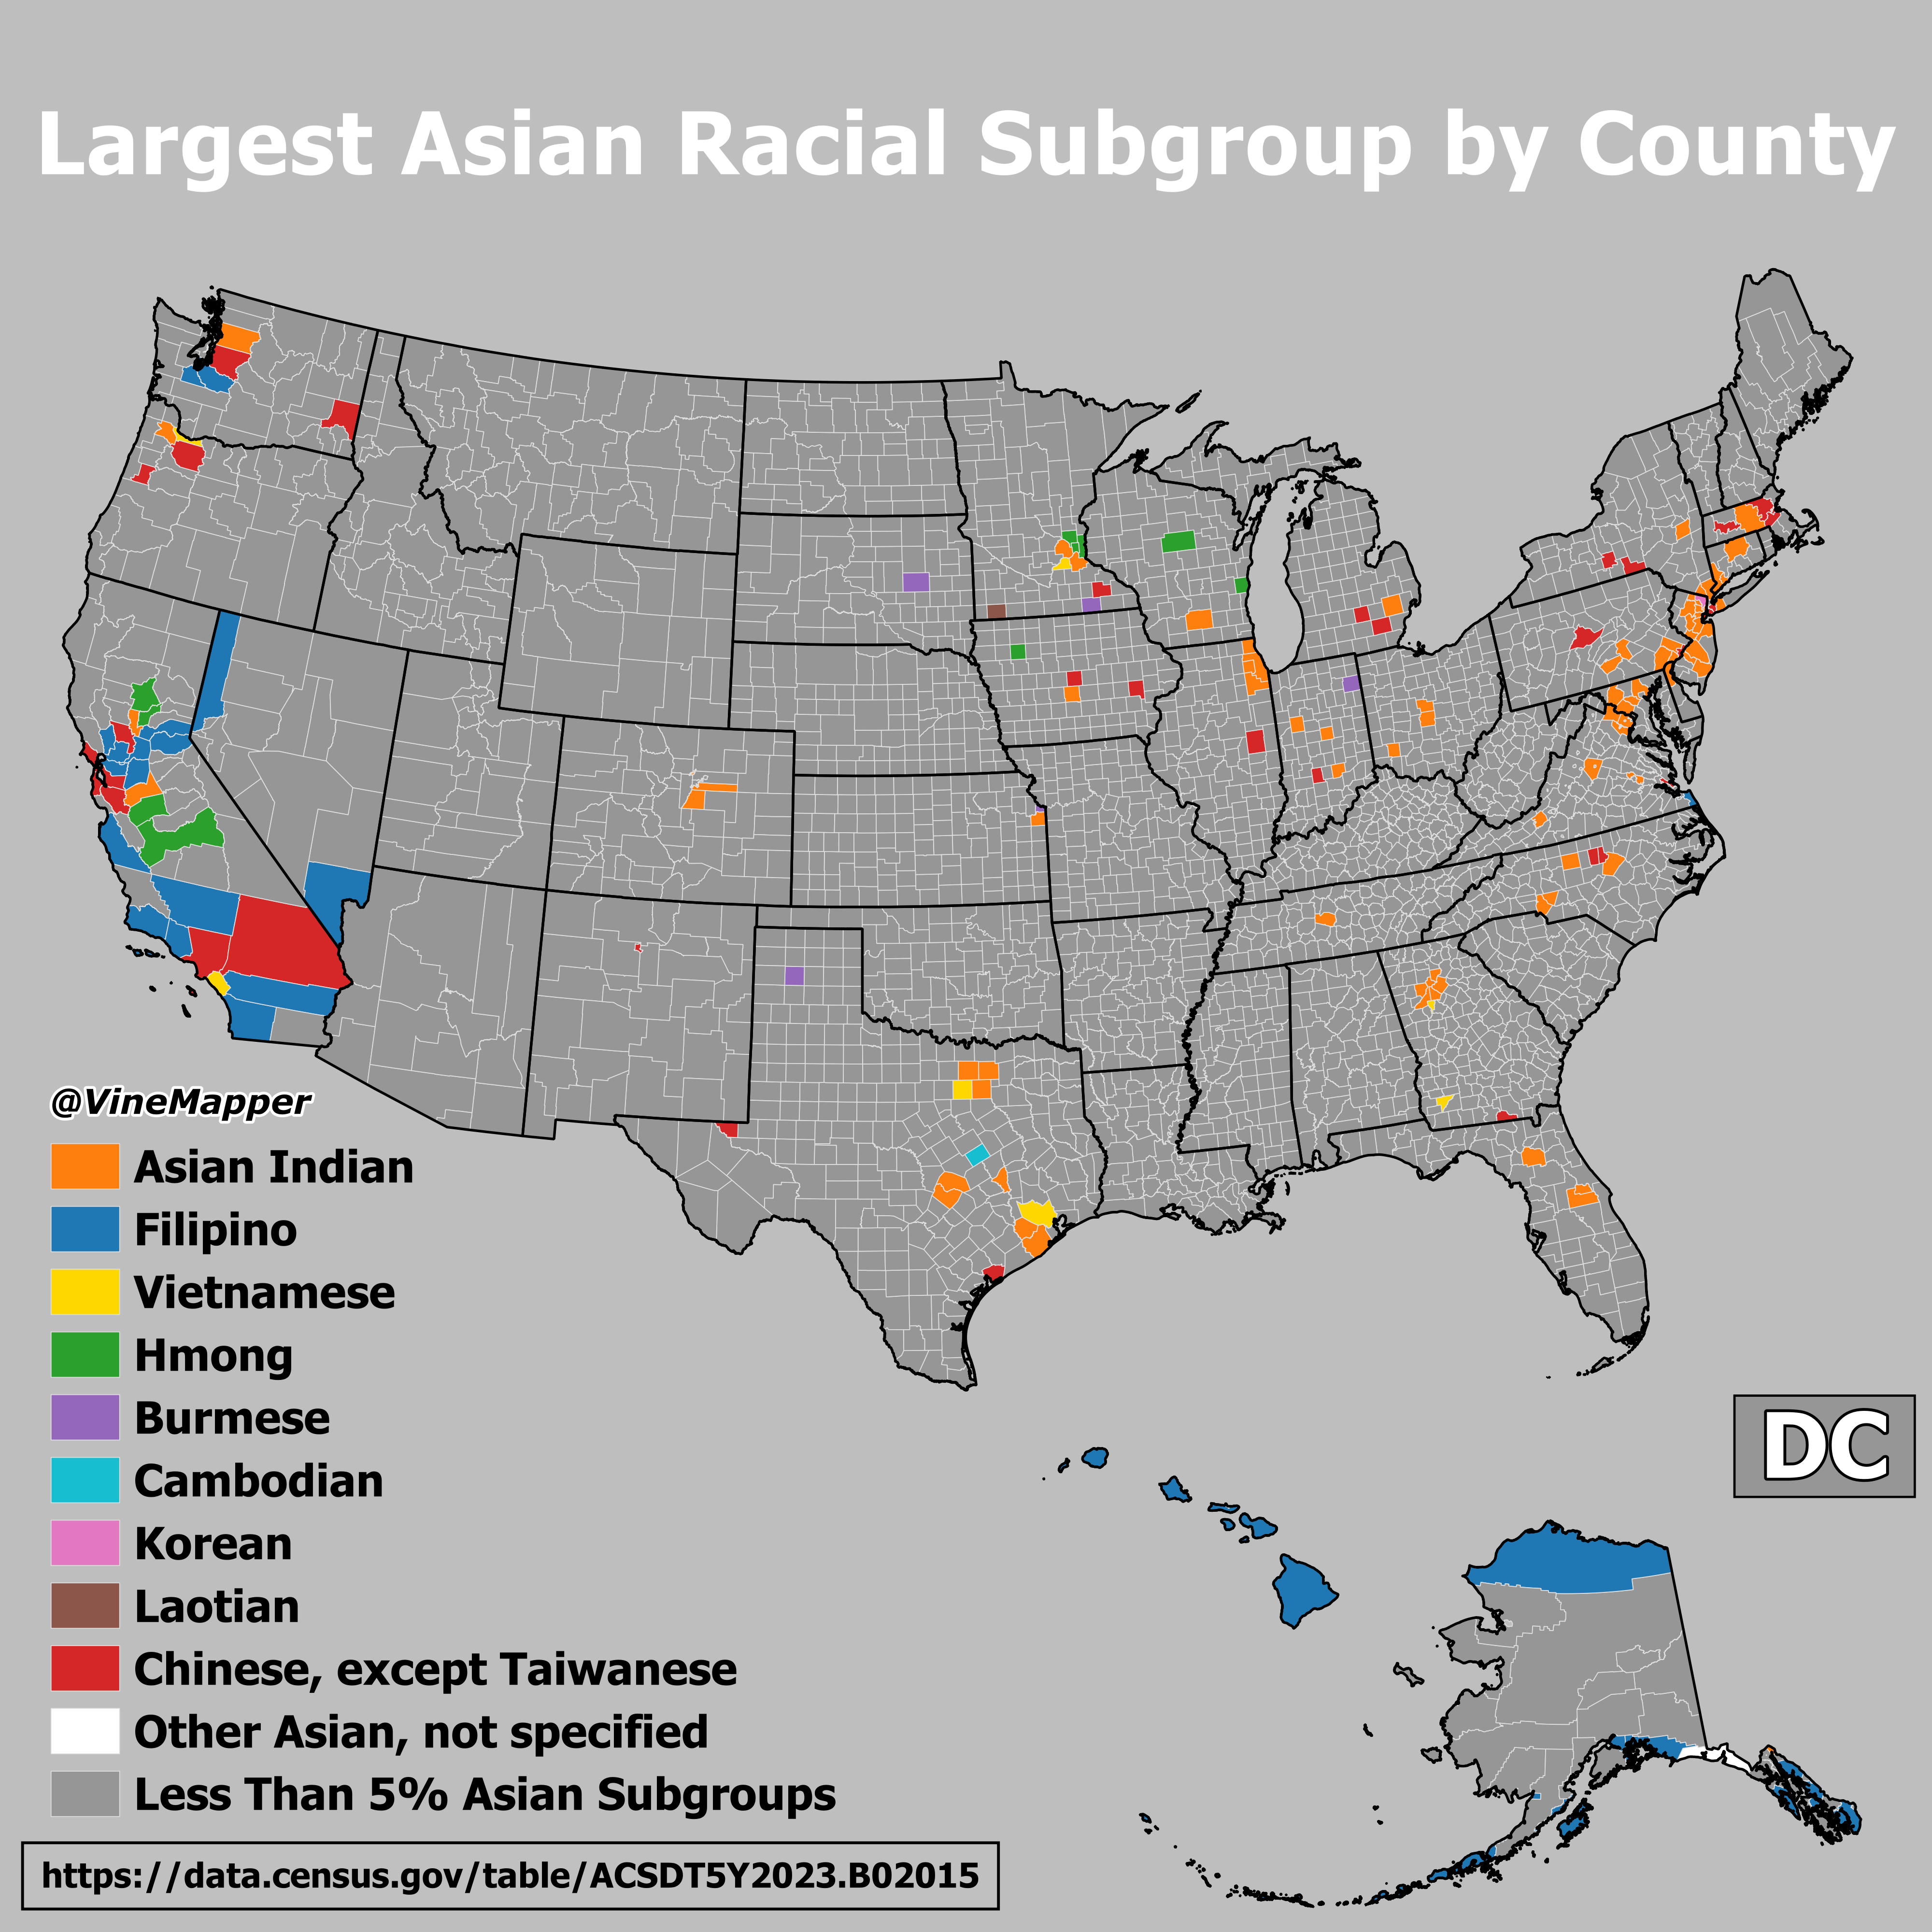
The "Largest Asian Racial Subgroup by County Map" provides a detailed visualization of the predominant Asian racial subgroups across various counties in the United States. Each county is color-coded to indicate which specific Asian subgroup—such as Chinese, Indian, Vietnamese, or Filipino—constitutes the largest percentage of the population. This map is not just a representation of numbers; it illustrates the rich tapestry of Asian cultures and communities that contribute to the diverse demographic landscape of the U.S.
Deep Dive into Asian Demographics
The Asian population in the United States has been one of the fastest-growing demographic groups over the last few decades. According to the U.S. Census Bureau, the Asian population reached approximately 24 million in 2020, accounting for about 7.2% of the total U.S. population. This growth has been fueled by immigration, higher birth rates, and a younger demographic compared to other racial groups. Interestingly, the Asian community is not monolithic; it encompasses a wide range of racial subgroups, each with its unique cultural heritage and history.
Among these subgroups, Chinese Americans are the largest, making up about 23% of the Asian population, followed closely by Indian Americans at around 20%. Other significant groups include Filipinos, Vietnamese, and Koreans. This diversity is reflected in various aspects of life, from cuisine and festivals to languages and traditions. For instance, you may notice that areas with a high concentration of Chinese Americans often celebrate Lunar New Year with grand parades, while Indian Americans host Diwali festivals that illuminate city streets.
The geographic distribution of these subgroups varies significantly. For instance, Chinese Americans are most prevalent in urban centers like San Francisco and Los Angeles, while Indian Americans have a strong presence in suburbs around cities such as New York and Chicago. This demographic pattern is influenced by historical migration trends, economic opportunities, and existing community networks that attract new immigrants.
What’s fascinating is that the largest subgroup in a county can also indicate broader socio-economic trends. For example, counties with a predominant Indian population often have higher educational attainment levels, reflecting a trend of highly skilled immigrants coming to the U.S. for work in technology and healthcare fields. Conversely, areas with significant Vietnamese populations might highlight the historical context of the Vietnam War and its aftermath, influencing migration patterns and community resilience.
Regional Analysis
When we break down the map regionally, some interesting patterns emerge. The West Coast, particularly California, showcases a vibrant mosaic of Asian subgroups. In Los Angeles County, for instance, the largest Asian subgroup is the Chinese community, while in neighboring Orange County, it is predominantly Vietnamese. This reflects not only historical immigration patterns but also the establishment of ethnic enclaves that offer support and cultural continuity.
Moving to the East Coast, New York County (Manhattan) is primarily home to a rich mix of Chinese and Indian populations, reflecting the city's role as a melting pot of cultures. In contrast, counties in the Midwest, such as Cook County in Illinois, show a strong presence of both Indian and Pakistani communities, often linked to the growth of tech industries and universities that attract international students and professionals.
Interestingly, regions with a significant Filipino population, such as Hawaii and parts of California, often see these communities contributing to the local economy through industries such as healthcare and hospitality. The cultural influence of Filipino Americans is also notable in culinary scenes, with a growing visibility of Filipino cuisine in mainstream America.
Significance and Impact
Understanding the distribution of the largest Asian racial subgroups is essential for several reasons. It helps policymakers and community leaders address the unique needs of these populations, whether in education, healthcare, or social services. Furthermore, as the Asian American demographic continues to grow, it plays a crucial role in shaping the cultural, economic, and political landscape of the country.
Current trends indicate a continuing rise in diversity within the Asian community itself, with younger generations often identifying with multiple cultural backgrounds. This evolution presents both challenges and opportunities as communities strive for representation and inclusion. Moreover, as we look toward the future, projections suggest that the Asian population will continue to grow, potentially influencing everything from local economies to national policies.
In conclusion, the "Largest Asian Racial Subgroup by County Map" is not just a collection of data points; it tells the story of a vibrant and diverse population that enriches the American cultural fabric. By examining these patterns, we gain valuable insights into the dynamics of immigration, community development, and cultural exchange in modern America.
Visualization Details
- Published
- August 10, 2025
- Views
- 108
Comments
Loading comments...